Quantcast
Channel: Psychosomatic, Lobotomy, Saw
Viewing all 76 articles
Browse latest View live

Java Concurrency Torture Update: Don't Stress

$
0
0
A piece of late news: the concurrency suite is back. And so is my little test on top of it.
A few months ago I posted on yet another piece of joyful brilliance crafted by Master Shipilev, the java-concurrency-suite. I used the same framework to demonstrate some valid concerns regarding unaligned access to memory, remember children:
  • Unaligned access is not atomic
  • Unaligned access is potentially slow, in particular:
    • On older processors
    • If you cross the cache line
  • Unaligned access can lead to SEG_FAULT on non-intel architectures, and the result of that might be severe performance hit or your process crashing...
It was so much fun that someone had to put a stop to it, and indeed they did.
The java-concurrency-suite had to be removed from github, and the Master Inquisitor asked me to stop fucking around and remove my fork too, if it's not too much trouble... so I did.
Time flew by and at some point the powers that be decided the tool can return, but torture was too much of a strong word for those corporate types and so it has been rebranded JCStress. JC is nothing to do with the Jewish Community, as some might assume, it is the same Java Concurrency but now it's not torture (it's sanctioned after all), it's stress. Aleksey is simply stressing your JVM, he is not being excessively and creatively sadistic, that would be too much!
Following the article I had a short discussion with Mr T and Gil T with regards to unaligned access in the comments to Martin's blog post on off-heap tuple like storage. The full conversation is long, so I won't bore you, but the questions asked were:
  1. Is unaligned access a performance only, or also a correctness issue?
  2. Are 'volatile' write/reads safer than normal writes/reads?
The answers to the best of my understanding are:
  1. Unaligned access is not atomic, and therefore can lead to the sort of trouble you will not usually experience in your programs (i.e half written long/int/short values). This is a problem even if you use memory barriers correctly. It adds a 'happened-badly' eventuality to the usual happens before/after reasoning and special care must be taken to not get slapped in the face with a telephone pole.
  2. Volatile read/writes are NOT special. In particular doing a CAS/putOrdered/volatile write to an unaligned location such that the value is written across the cache line is NOT ATOMIC (this statement is under further investigation. At the very least a volatile read is definitely not atomic. More on this issue to follow).
This came up in a discussion recently, which prompted me to go and fork JCStress on to bitbucket and rerun the experiments on both a Core2Duo and a Xeon processor and re-confirmed the result. This is a problem for folks considering the Atomics for ByteBuffer suggestion discussed on the concurrency-interest mailing list. There is nothing in the ByteBuffer interface to stop you from doing unaligned access...


Atomicity of Unaligned Memory Access in Java

$
0
0
This is an attempt to clarify and improve on previous statements I've made here (and before that here) on unaligned memory access and it's implications. Let's start from the top:
  1. Unaligned access is reading/writing a short/int/long from/to an address that is not divisible by it's size.
  2. Unaligned access to data on the heap is not possible without using sun.misc.Unsafe.
  3. Unaligned access to data off the heap is possible via direct ByteBuffer.
  4. Unaligned access to data is very possible using unsafe both on/off heap.
  5. Unaligned access is therefore bad news even for good boys and girls using direct ByteBuffer, as the result on unaligned access are architecture/OS specific. You may find that your code crashes inexplicably on some processes when running some OSs.
  6. Unaligned access atomicity pure and simple is not a JVM issue. You can only "legally" do it by using direct ByteBuffer, and that is explicitly not a thread safe object so you are in no position to expect atomicity (As an aside, in heap ByteBuffers all writes are not atomic)
  7. What happens on unaligned access stays on unaligned access ;-)
So unaligned access is a problem for the few, and concurrent unaligned access is a problem for naughty, tricksy hobbitses who want to play with matches. Such devils may want to write an IPC, or use off heap memory to store structs, and are hoping to get coherent results. Here's my results thus far for x86 processors. Skip to the summary at the end if you don't care for the journey.

Unaligned access within the cache line

Unaligned access within the cache line is not atomic on older Intel processors, but is atomic on later models (from the intel developer manual under 8.1.1 Guaranteed Atomic Operations): 
"The P6 family processors (and newer processors since) guarantee that the following additional memory operation will always be carried out atomically: 
  • Unaligned 16-, 32-, and 64-bit accesses to cached memory that fit within a cache line"
To demonstrate this time around I'll use a simpler means than JCStress and just roll my own, the same tests are available on my fork of JCStress here. The same test will be used for the cross line test, and it covers all 3 flavours of visible writes (ordered/volatile,CAS):
We expect the test to run forever (or as long as we need to feel comfortable) if the writes are atomic. If they are not we expect the test to write "WTF" and exit early. Running the test for all write variations with an offset of 12 leads to no breakage of atomicity when run on a Core2Duo and Xeon, this test should break (i.e exit early, WTF) on older processors and this result has been confirmed to indeed happen.
So far so good, unaligned access is confirmed atomic on recent Intel processors and the evidence supports the documentation.


Unaligned access across the cache line

Crossing the cache line falls outside the scope of the prev. statement quoted so is not atomic unless we use the LOCK instruction (see under 8.1.2.2 Software Controlled Bus Locking):
"The integrity of a bus lock is not affected by the alignment of the memory field. The LOCK semantics are followed for as many bus cycles as necessary to update the entire operand. However, it is recommend that locked accesses be aligned on their natural boundaries for better system performance... Locked operations are atomic with respect to all other memory operations and all externally visible events."
Cool, so... which one is locked? One way to find out is run the test, so I did.... and... it looks like none...
So nothing is locked? that seemed wrong.
Certainly CAS is locked. CAS translates directly into LOCK CMPXCHG, so definitely locked, and yet the experiment definitely fails. This is as far as I got with JCStress, and this result raised some eyebrows. Re-reading through the code I wrote for JCStress didn't raise any suspicion, so I wrote a variation of the above test and still it looked like the CAS values are broken.
I have to admit I was happy to leave it at that, and in some ways it is not a wrong conclusion, but I met with some insistent doubt from Mr. Gil Tene of Azul. With both Gil and the Intel manual insisting this is not right I had a final go at cracking this contradiction and read through the assembly. The CAS writes are indeed as expected LOCK CMPXCHG, but the volatile read is:
  0x0000000106b5d60c: movabs r10,0x7f92a38248fc
  0x0000000106b5d616: mov    r10,QWORD PTR [r10]  ;*invokevirtual getLongVolatile
A MOV with no lock! So it is perhaps not the CAS that is broken, it is the volatile read. To prove the point I change the test for broken values to be:

And indeed, with this version CAS is proved to never deliver broken values, CAS is atomic across the cache line. But... as far as Java is concerned, this is only of use if you want to use CAS to test for the written values, which is not that useful. This highlights the fact that while CAS is implemented using LOCK CMPXCHG, it does not have the same interface. CMPXCHG returns the current value even on failure. That would have been exactly what we'd want to replace the volatile read in this particular and admittedly perverse case.
Now with the new atomic observation we can re-examine the atomicity of the ordered and volatile writers. And find, to our shared joy/sorrow that they are just as broken as before. The ordered write should come as no surprise as it is a plain MOV, but the volatile write is a bit surprising (to me if not to others. Gil for instance wasn't surprised, the clever bastard). It's a close call thing, you could implement a volatile write using a single locked instruction (LOCK XCHG), but the actual implementation is via a MOV followed by a LOCK ADD (see end of Martin's post and comments for discussion on that implementation choice). As things currently stand, cache line crossing volatile writes are not atomic.

Summary & Credits

Rules of unalignment thus far are:
  1. If you can at all help it, read and write aligned data.
  2. Unaligned writes and reads within the cache line are atomic on recent Intel processors, but not atomic on older models.
  3. Unaligned writes and reads across the cache line are not atomic unless they are locked.
  4. Of the available options, only CAS is locked. There is no locked way to read an arbitrary value.
  5. Volatile/Ordered writes are not atomic, volatile read is also not atomic.
The above is true for Intel x86, but I would not expect other processors to behave the same.
This post is really a summary of the combined efforts and ideas by Gil, Martin (thanks guys) and myself. Any errors are in all probability mine, please let me know if you find any. The test code is here, you can run with any offset, write type or read type by playing with the system properties, have a play and let me know your results. I'm particularly curious to hear from anyone running on non-intel processors who can share their results.

JMM Cookbook Footnote: NOOP Memory Barriers on x86 are NOT FREE

$
0
0
In Doug Lea's excellent JMM Cookbook the following observation is made about memory barriers on different architectures:
ProcessorLoadStoreLoadLoadStoreStoreStoreLoadData
dependency
orders loads?
Atomic
Conditional
Other
Atomics
Atomics
provide
barrier?
sparc-TSOno-opno-opno-opmembar (StoreLoad)yesCAS: casaswap,ldstubfull
x86no-opno-opno-opmfence or
cpuid or
locked insn
yesCAS:
cmpxchg
xchg,
locked insn
full
ia64combine
with

st.rel or
ld.acq
ld.acqst.relmf yesCAS:
cmpxchg
xchg,
fetchadd
target +
acq/rel
armdmb
(see below)
dmb
(see below)
dmb-stdmbindirection
only
LL/SC:
ldrex/strex

target
only
This leads quite a few people to conclude that there is no performance cost to the memory barriers that are marked no-op, and on occasion leads people to believe they can just not put them in at all. After all, what is the point in a no-op? surely a program with the no-ops removed is the same program, right? Wrong...
After having this debate again recently I thought I'd document it here to avoid repetition, and to get some second opinions I got some help from the good people on the concurrency-interest mailing list.

What's a Memory Barrier?

This is Noop
From the Cookbook:
"Compilers and processors must both obey reordering rules. No particular effort is required to ensure that uniprocessors maintain proper ordering, since they all guarantee "as-if-sequential" consistency. But on multiprocessors, guaranteeing conformance often requires emitting barrier instructions...
...Memory barrier instructions directly control only the interaction of a CPU with its cache, with its write-buffer that holds stores waiting to be flushed to memory, and/or its buffer of waiting loads or speculatively executed instructions."
We need memory barriers to help the compiler and CPU make sense of our intentions in terms of concurrency. We need to hold them back from optimizing away code that can be eliminated or re-ordered if optimal single threaded execution is the only consideration. The last bit suggests that barriers are really about memory ordering.

Why isn't it free?

Volatile reads (LoadLoad) and lazySet/putOrdered (StoreStore) are both "No-op"s on x86. Mike Barker (LMAX dude, maintainer and contributor to the Disruptor, here's his blog) replied to my request for clarification:
"The place to look (as definitive as it gets for the hardware) is section 8.2.2, volume 3A of the Intel programmer manual.  It lists the rules that are applied regarding the reordering of instructions under the X86 memory model.  I've summarised the relevant ones here:
- Reads are not reordered with other reads.
- Writes are not reordered with older reads.
- Writes to memory are not reordered with other writes.
- Reads may be reordered with older writes to different locations but not with older writes to the same location.
The only reordering that will occur with x86 is allowing reads to be executed before writes (to other locations), hence the need for a LOCKed instruction to enforce the store/load barrier.  As you can see with the above rules, store are not reordered with older stores and loads are not reordered with older loads so a series of MOV instructions is sufficient for a store/store or a load/load barrier."
So since a volatile read and a lazySet both boil down to a MOV from/to memory, no further special instruction is required (hence no-op) as the underlying architecture memory model obeys the rules required by the JMM (Note: lazySet is not in the JMM, but is as good as in it, I go into the origins of lazySet here). But while that does mean these barriers are cheap it doesn't make them free. The above rules Mike is quoting are for the generated assembly, but the barriers impact the compiler as well. Memory barriers are there to stop your code being interpreted a particular way by both the compiler and the CPU. The JMM guarantees that memory barriers are respected by BOTH. This is important because the JMM Cookbook is talking about CPU no-ops, not compiler no-ops. Vitaly Davidovich from concurrency interest replied:
"Yes, volatile loads and lazySet do not cause any cpu fence/barrier instructions to be generated - in that sense, they're noop at the hardware level.  However, they are also compiler barriers, which is where the "cheap but ain't free" phrase may apply. The compiler cannot reorder these instructions in ways that violate their documented/spec'd memory ordering effects. So for example, a plain store followed by lazySet cannot actually be moved after the lazySet; whereas if you have two plain stores, the compiler can technically reorder them as it sees fit (if we look at just them two and disregard other surrounding code). So, it may happen that compiler cannot do certain code motion/optimizations due to these compiler fences and therefore you have some penalty vs using plain load and stores.  For volatile loads, compiler cannot enregister the value like it would with plain load, but even this may not have noticeable perf diff if the data is in L1 dcache, for example."
The difference in performance between using a plain write and a lazySet has been demonstrated in this post if you look at the difference between the putOrdered and plain writes versions. I expect this difference is far more pronounced in a benchmark than in a full blown system, but the point is it's a demonstrable difference. Similarly here Mr. Brooker demonstrates there is a difference between normal reads and volatile reads. There's a flaw in the experiment in that the volatile writes are making the volatile reads slower, but his point is valid as a demonstration of inhibited optimization (loop is not unrolled, value is not enregistered) and the uncontended read tells that story well.

So... I can't just drop it out of my program?

The TSO model for x86 dictates how your code will behave, if you were writing assembly. If you are writing Java, you are at the mercy of the JIT compiler first, and only then the CPU. If you fail to inform the compiler about your intentions, your instructions may never hit the CPU, or may get there out of order. Your contract is with the JMM first.
It's like punctuation: "helping your uncle Jack off a horse" != "helping your uncle jack off a horse" => punctuation is not a no-op ;-)

Diving Deeper into Cache Coherency

$
0
0
I recently gave a talk about Mechnical Sympathy at Facebook, which was mostly a look at the topic through the SPSC queue optimization series of posts. During the talk I presented the optimisation step (taken in Martin's original series of queue implementations) of adding a cache field for the head and tail. Moving from this:

To this:


This change yields a great improvement in throughput which I explained to be down to the reduction in coherency traffic between the cores. This is:
  1. Not what I stated previously here.
  2. A very brief and unsatisfying explanation.
I shall try and remedy that in this post.


Penance

In my original step by step post I explained the benefit of the above optimization is the replacement of a volatile read with a plain read. Martin was kind enough to gently correct me in the comments:
"The "volatile read" is not so much the issue. The real issues come from the read of the head or tail from the opposite end will pretty much always result in a cache miss. This is because the other side is constantly changing it."
and I argued back, stating the JIT compiler can hoist the field into a register and wistfully wishing I could come up with an experiment to prove one way or the other.  I was mostly wrong and Martin was totally right. 
I say mostly and not entirely because eliminating volatile reads is not a bad optimization and is responsible for part of the perf improvement. But it is not the lion share. To prove this point I have hacked the original version to introduce volatile reads (but still plain writes) from the headCache/tailCache fields. I won't bore you with the code, it's using the field offset and Unsafe.getLongVolatile to do it.
I ran the test cross core for 30 times and averaged the summary results. Running on new hardware (so no reference point to prev. quoted results) i7-4700MQ/Ubuntu 13.04/JDK7u25. Here are the results, comparing Original21 (head/tail padded, no cache fields), Original3 (head/tail padded, head/tailCache padded) and VolatileRead (same as Original3, but with volatile read of cache fields):

Original21:     65M ops/sec
Original3:     215M ops/sec
VolatileRead:  198M ops/sec

As we can see, there is no massive difference between Original3 and VolatileRead (especially when considering the difference from Original21), leading me to accept I need to buy Martin a beer, and apologize to any reader of this blog who got the wrong idea reading my post.
Exercise to the reader: I was going to run the above with perf to quantify the impact on cache-misses, but as perf doesn't support this functionality on Haswell I had to let it go. If someone cares to go through the exercise and post a comment it would be most welcome.


What mean cache coherency?

Moving right along, now that we accept the volatile read reduction is not the significant optimization here, let us dig deeper into this cache coherency traffic business. I'll avoid repeating what is well covered elsewhere (like cache-coherence, or MESIF on wikipedia, or this paper, some excellent examples here, and an animation for windows users only here) and summarize:
MESI State Diagram
  • Modern CPUs employ a set of caches to improve memory access latency.
  • To present us with a consistent view of the world when concurrent access to memory happens the caches must communicate to give us a coherent state.
  • There are variations on the protocol used. MESI is the basic one. Recent intels use MESIF. In the examples below I use MESI as the added state in MESIF adds nothing to the use case.
  • The guarantee they go for is basic:
    • One change at a time (to a cache line): A line is never in M state in more than one place. 
    • Let me know if I need a new copy: If I have a copy and someone else changed it I need to get me a new copy. (My copy will move from Shared to Invalid)
All of this happens under the hood of your CPU without you needing to lose any sleep, but if we somehow cause massive amounts of cache coherency traffic then our performance will suffer. One note about the state diagram. The observant reader (thanks Darach) will notice the I to E transition for Processor Write(PW) is in red. This is not my diagram, but I think the reason behind it is that the transition is very far from trivial (or a right pain in the arse really) as demonstrated below.


False Sharing (once more)

False sharing is a manifestation of this issue where 2 threads are competing to write to the same cache line which is constantly Invalid in their own cache.

Here's a blow by blow account of false sharing in terms of cache coherency traffic:
  1. Thread1 and Thread2 both have the false Shared cache line in their cache
  2. Thread1 modifies HEAD (state goes from S to E), Thread2's copy is now Invalid
  3. Thread2 wants to modify TAIL but his cache line is now in state I, so experiences a write miss:
    1. Issue a Read With Intent To Modify (RWITM)
    2. RWITM intercepted by Thread1
    3. Thread1 Invalidates own copy
    4. Thread1 writes line to memory
    5. Thread2 re-issues RWITM which results in read from memory (or next layer cache)
  4. Thread1 wants to write to HEAD :( same song and dance again, the above gets in it's way etc.

The diagram to the right is mine, note the numbers on the left track the explanation and the idea was to show the cache lines as they mutate on a timeline. Hope it helps :-).


Reducing Read Misses

So False Sharing is really bad, but this is not about False Sharing (for a change). The principal is similar though. With False Sharing we get Write/Read misses, the above manoeuvre is about eliminating Read misses. This is what happens without the HEADC/TAILC fields (C for cache):
  1. Thread1 and Thread2 both have the HEAD/TAIL  cache lines in Shared state in their cache
  2. Thread1 modifies HEAD (state goes from S to E), Thread2's copy is now Invalid
  3. Thread2 wants to read HEAD to check if the queue wrapped, experiences a Read Miss:
    1. Thread2 issues a request for the HEAD cache line
    2. Read is picked up by Thread1
    3. Thread1 delivers the HEAD cache line to Thread2, the request to memory is dropped
    4. The cache line is written out to main memory and now Thread1/2 have the line in Shared state
This is not as bad as before, but is still far from ideal. The thing is we don't need the latest value of HEAD/TAIL to make progress, it's enough to know that the next increment to our counter is available to be used. So in this use case, caching the head/tail gives us a great win by avoiding all of these Read Misses, we only hit the Read Miss when we run out of progress to be made against our cached values. This looks very different:
  1. Thread1 and Thread2 both have the HEAD/TAIL/HEADC/TAILC  cache lines in Shared state in their cache (the TAILC is only in Thread1, HEADC is only in Thread2, but for symmetry they are included).
  2. Thread1 reads TAILC and modifies HEAD (state goes from S to E), Thread2's copy is now Invalid.
  3. Thread2 reads from HEADC which is not changed. If TAIL is less than HEADC we can make progress (offer elements) with no further delay. This continues until TAIL is equal to HEADC. As long as this is the case HEAD is not read, leaving it in state M in Thread1's cache. Similarly TAIL is kept in state M and Thread2 can make progress. This is when we get the great performance boost as the threads stay out of each others way.
  4. Thread1 now needs to read TAIL to check if the queue wrapped, experiences a Read Miss:
    1. Thread1 issues a request for the TAIL cache line
    2. Request is picked up by Thread2
    3. Thread2 delivers the TAIL cache line to Thread1, the request to memory is dropped
    4. The cache line is written out to main memory and now Thread1/2 have the line in Shared state
    5. TAIL is written to TAILC (TAILC line is now E)
The important thing is that we spend most of our time not needing the latest HEAD value which means Thread2 is not experiencing as many Read Misses, with the added benefit of the threads not having to go back and forth from Shared to Exclusive/Modified state on writes. Once I have a line in the M state I can just keep modifying with no need for any coherence traffic. Also note we never experience a Write Miss.


Summary

In an ideal application (from a cache coherency performance POV) threads never/rarely hit a read or write miss. This translates to having single writers to any piece of data, and minimizing reads to any external data which may be rapidly changing. When we are able to achieve this state we are truly bound by our CPU (rather than memory access).
The takeaway here is: Fast moving data should be in M state as much as possible. A read/write miss by any other thread competing for that line will lead to reverting to S/I which can have significant performance implications. The above example demonstrates how this can achieved by caching stale but usable copies locally to another thread.

SPSC revisited part III - FastFlow + Sparse Data

$
0
0
After I published the last post on this topic (if you want to catchup on the whole series see references below) I got an interesting comment from Pressenna Sockalingasamy who is busy porting the FastFlow library to Java. He shared his current implementation for porting the FastFlow SPSC queue (called FFBuffer) and pointed me at a great paper on it's implementation. The results Pressenna was quoting were very impressive, but when I had a close look at the code I found what I believed to be a concurrency issue, namely there were no memory barriers employed in the Java port. Our exchange is in the comments of the previous post. My thoughts on the significance of memory barriers, and why you can't just not put them in are recorded here.
Apart from omitting the memory barriers the FFBuffer offered two very interesting optimizations:
  1. Simplified offer/poll logic by using the data in the queue as an indicator. This removes the need for tracking the relative head/tail position and using those to detect full/empty conditions.
  2. Sparse use of the queue to reduce contention when the queue is near full or near empty (see musings below). This bloats the queue, but guarantees there are less elements per cache line (this one is an improvement put in by Pressenna himself and not part of the original)
So after getting off my "Memory Barriers are important" high horse, I stopped yapping and got to work seeing what I can squeeze from these new found toys.

FFBuffer - Simplified Logic

The simplified logic is really quite compelling. If you take the time to read the paper, it describes the queue with offer/poll loop I've been using until now as Lamport's circular buffer (the original paper by Lamport is here, not an easy read), full code is here, but the gist is:

I've been using a modified version which I got from a set of examples put forth by Martin Thompson as part of his lock free algos presentation and evolved further as previously discussed(padding is omitted for brevity):

With the FFBuffer variant Pressenna sent my way we no longer need to do all that accounting around the wrap point (padding is omitted for brevity):

The new logic is simpler, has less moving parts (no head/tail caching) and in theory looks like cache coherency traffic should be reduced by only bringing in the array elements which are required in any case.

The Near Empty/Full Queue Problem

At some point while testing the different queues I figured the test harness itself may be to blame for the run to run variance I was seeing. The fun and games I had are a story to be told some other time, but one of the thing that emerged from these variations on the test harness was the conclusion that testing a near empty queue produces very different results. By reversing the thread relationship (Main is producer, other thread is consumer, code here) in the test harness I could see great performance gains, the difference being that the producer was getting a head start in the race, creating more slack to work with. This was happening because the consumer and the producer are experiencing contention and false sharing when the queue has 1 to 16 elements in it. The fact that the consumer is reading a cache row that is being changed is bad enough, but it is also changing the same line by setting the old element to null. The nulling out of elements as they are read is required to avoid memory leaks. Also note that when the consumer/producer run out of space to read/write as indicated by their cached view of the tail/head they will most likely experience a read miss with the implications discussed previously here.
Several solutions present themselves:
  • Batch publication: This is a problem for latency sensitive applications and would require the introduction of some timely flush mechanism to the producer. This is not an issue for throughput focused applications. Implementing this solution will involve the introduction of some batch array on the producer side which is 'flushed' into the queue when full. If the batch array is longer than a cache line the sharing issue is resolved. An alternative solution is to maintain a constant distance between producer and consumer by changing the expectation on the consumer side to stop reading at a given distance.
  • Consumer batch nulling: Delay the nulling out of read elements, this would reduce the contention but could also result in a memory leak if some elements are never nulled out. This also means the near empty queue is still subject to a high level of coherency traffic as the line mutates under the feet of the reader.
  • Padding the used elements: We've taken this approach thus far to avoid contention around fields, we can apply the same within the data buffer itself. This will require us to use only one in N cells in the array. We will be trading space for contention, again. This is the approach taken above and it proves to work well.

Good fences make good neighbours

As mentioned earlier, the code above has no memory barriers, which made it very fast but also incorrect in a couple of rather important ways. Having no memory barriers in place means this queue can:
  • Publish half constructed objects, which is generally not what people expect from a queue. In a way it means that notionally stuff can appear on the other side of the queue before you sent it (because the code is free to be reordered by the compiler). 
  • The code can be reordered such that the consumer ends up in an infinite busy loop (the read value from the array can be hoisted out of the reading loop).
I introduced the memory barriers by making the array read volatile and the array write lazy. Note that in the C variation only a Write Memory Barrier is used, I have implemented variations to that effect but while testing those Pressenna informed me they hang when reading/writing in a busy loop instead of yielding (more on this later). Here's the final version (padding is omitted for brevity):

There are a few subtleties explored here:
  • I'm using Unsafe for array access, this is nothing new and is a cut and paste job from the AtomicReferenceArray JDK class. This means I've opted out of the array bound checks we get when we use arrays in Java, but in this case it's fine since the ring buffer wrapping logic already assures correctness there. This is necessary in order to gain access to getVolatile/putOrdered.
  • I switched Pressanas original field padding method with mine, mostly for consistency but also it's a more stable method of padding fields (read more on memory layout here).
  • I doubled the padding to protect against pre-fetch caused false sharing (padding is omitted above, but have a look at the code).
  • I replaced the POW final field with a constant (ELEMENT_SHIFT). This proved surprisingly significant in this case. Final fields are not optimized as aggressively as constants, partly due to the exploited backdoor in Java allowing the modification of final fields (here's Cliff Click's rant on the topic). ELEMENT_SHIFT is the shift for the sparse data and the shift for elements in the array (inferred from Unsafe.arrayIndexScale(Object[].class)) combined.
How well did this work? Here is a chart comparing it to the the latest queue implementation I had (Y5 with/Y4 without Unsafe array access), with sparse data shift set to 0 and 2 (benchmarked on Ubuntu13.04/JDK7u40/i7-4700MQ@2.40GHz using JVM params: -XX:+UseCondCardMark -XX:CompileThreshold=100000 and pinned to run across cores, results from 30 runs are sorted to make the the charts more readable):
Y=Ops per second, X=benchmark run
Shazzam! This is a damn fine improvement note that the algorithm switch is far less significant than the use of sparse data.
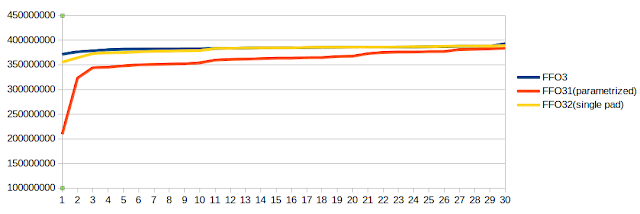
To further examine the source of the gain I benchmarked a variant with the element shift parametrized and a further variant with single padding (same machine and settings as above, sparse shift is 2 for all):
Y=Ops per second, X=benchmark run
Single padding seems to make little difference but parametrization is quite significant.

Applying lessons learnt

Along the way, as I was refining my understanding of the FFBuffer optimizations made above I applied the same to the original implementation I had. Here are the incremental steps:

  1. Y4 - Starting point shown above.
  2. Y5 - Use Unsafe to access array (regression).
  3. Y6 - Use sparse elements in the buffer.
  4. Y7 - Double pad the fields/class/array.
  5. Y8 - Put head/tailCache on same line, put tail/headCache on another line.
  6. Y81 - From Y8, Parametrize sparse shift instead of constant (regression).
  7. Y82 - From Y8, Revert to using array instead of Unsafe access (regression).
  8. Y83 - From Y8, Revert double padding of fields/class/array (regression).

Lets start with the journey from Y4 to Y8:
Y=Ops per second, X=benchmark run
Note the end result is slightly better than the FF one, though slightly less stable. Here is a comparison between Y8 and it's regressions Y81 to Y83:
Y=Ops per second, X=benchmark run
So... what does that tell us?

  • The initial switch to using Unsafe for array access was a regression as a first step (Y5), but proves a major boost in the final version. This is the Y82 line. The step change in its performance I think is down to the JIT compiler lucking out on array boundary check elimination, but I didn't check the assembly to verify.
  • Parametrizing is an issue here as well, more so than for the FFBuffer implementation for some reason.
  • I expected Y83 (single padding) to be the same or worse than Y6. The shape is similar but it is in fact much better. I'm not sure why...
  • There was a significant hiccup in the field layout of Y4/5/6 resulting in the bump we see in going from Y6 to Y7 and the difference between Y83 and Y6. As of now I'm not entirely certain what is in play here. It's clear that pre-fetch is part of it, but I still feel I'm missing something.
So certainly not all is clear in this race to the top but the end result is a shiny one, let's take a closer look at the differences between Y8 and FFO3. Here's a comparison of these 2 with sparse data set to 0,1,2,3,4 running cross cores:
From these results it seems that apart from peaking for the s=2 value, Y8 is generally slower than FFO3. FFO3 seems to improve up to s=3, then drop again for s=4. To me this suggests FFO3 is less sensitive to the effect of the near empty queue as an algorithm.
Next I compared the relative performance of the 2 queue when running on the same core, this time only s=0, 2 where considered:
This demonstrates that FFO3 is superior when threads are running on the same core and still benefits from sparse data when running in that mode. Y8 is less successful and seem to actually degrade in this scenario when sparse data is used. Y8 offers a further optimization direction I have yet to fully explore in the form of batching consumer reads, I will get back to it in a further post.

On Testing And A Word Of Warning

I've been toying around with several test harnesses which are all on GitHub for you to enjoy. The scripts folder also allows running the tests in different modes (you may want to adjust the taskset values to match your architecture). Please have a play. Mostly the harnesses differ in the way they measure the scope of execution and which thread (producer/consumer) acts as the trigger for starting the test and so on. Importantly you will find there is the BusyQueuePerfTest which removes the Thread.yield() call when an unsuccessful offer/poll happens.
During the long period in which this post has been in the making (I was busy, wrote other posts... I have a day job... it took forever) Pressana has not been idle and got back to me with news that all the implementations which utilize Unsafe to access the array (Y5/SPSCQueue5 and later,  most of the FFBuffer implementations) were in fact broken when running the busy spin test and would regularly hang indefinitely. I tested locally and found I could not reproduce the issue at all for the SPSCQueue variations and could only reproduce it for the FFBuffer implementations which used no fences (the original) or only the STORE/STORE barrier (FFO1/2). Between us we have managed to verify that this is not an issue for JDK7u40 which had a great number of concurrency related bug fixes in it, but is an issue for previous versions! I strongly suggest you keep this in mind and test thoroughly if you intend to use this code in production.


Summary

This post has been written over a long period, please forgive any inconsistencies in style. It covers a long period of experimentation and is perhaps not detailed enough... please ask for clarifications in comments and I will do my best to  answer. Ultimately, the source is there for you to examine and play with and has the steps broken down such that a diff between step should be helpful.
This is also now part 5 in a series of long running posts, so if you missed any or forgotten it all by now here they are:
  1. Single Producer/Consumer lock free Queue step by step: This is covering the initial move from tradition JDK queues to the lock free variation used as a basis for most of the other posts
  2. 135 Million messages a second between processes in pure Java: Taking the queue presented in the first post and taking it offheap and demonstrating its use as an IPC transport via a memory mapped file
  3. Single Producer Single Consumer Queue Revisited: An empiricist tale - part I: Looking at run to run variation in performance in the original implementation and trying to cure it by inlining the counter fields into the queue class
  4. SPSC Revisited - part II: Floating vs Inlined Counters: Here I tried to access to impact of inlining beyond fixing up the initial implementations exposure to false sharing on one side.
And here we are :-), mostly done I think.
I would like to thank Pressana for his feedback, contribution and helpful discussion. He has a website with some of his stuff on, he is awesome! As mentioned above the idea for using sparse data is his own (quoting from an e-mail):
"All I tried was to cache align access to the elements in the array as it is done in plenty of c/c++ implementations. I myself use arrays of structs to ensure cache alignment in C. The same principle is applied here in Java where we don't have structs but only an array of pointer. "
Finally, the end result (FFO3/Y8) is incredibly sensitive to code changes as the difference between using a constant and field demonstrates, but also performs very consistently between runs. As such I feel there is little scope for improvement left there... so maybe now I can get on to some other topics ;-).

A Lock Free Multi Producer Single Consumer Queue - Round 1

$
0
0
Writing a lock free MPSC queue based on the previous presented SPSC queues and exploring some of the bottlenecks inherent in the requirements and strategies to clearing them. 
2 or more...

Having just recovered from a long battle with the last of SPSC queue series posts I'm going to keep this short. This time we are looking at a slightly more common pattern, many producing threads put stuff on a queue which funnels into a single consumer thread. Maybe that queue is the only queue allowed to perform certain tasks (like accessing a Selector, or writing to a socket or a file). What could we possibly do for this use case?

Benchmark

We'll be comparing the performance of the different alternatives using this benchmark which basically does the following:
  1. Allocate a queue of the given size (always 32k in my tests) and type
  2. Start N producer threads:
    1. A producer thread offers 10M/N items (yield if offer fails)
    2. Start time before first item is enqueued
  3. In main thread consume [10M * N] items from queue, keep last item dequeued
  4. Stop timing: END
  5. Overall time is [END - minimum start from producers], print ops/sec and the last dequeued item
  6. Repeat steps 2 to 5, 14 times, keep ops/sec result in an array
  7. Print out summary line with average ops/sec for last 7 iterations
Very similar to previous benchmark for SPSC. The producers all wait for the consumer to give the go ahead, so contention is at it's worse (insert evil laughter, howling dogs). I ran the tests a fair few  times to expose run to run variance on a test machine (Ubuntu13.04/JDK7u40/i7-4700MQ) with 1 to 6 producer threads. To make the graphs a little easier to grok I took a representative run and for now will leave run to run variance to be discussed separately.


Baseline JDK Queues: ArrayBlockingQueue, ConcurrentLinkedQueue and LinkedTransferQueue

These are battle tested long standing favourites and actually support MPMC, so are understandably less specialized. ArrayBlockingQueue is also a blocking implementation, so we can expect it to experience some pain from that. Here's how they do:

We can see that CLQ/LTQ perform best when there's a single producer and quickly degrades to a stable baseline after a few producers join the party. The difference between 1 producer and many is the contention on offering items into the queue. Add to that the fact that the consumer is not suffering from the same amount of contention on it's side and we get a pile up of threads. ABQ gains initially from the addition of threads but then degrades back to initial performance. A full analysis of the behaviour is interesting, but I have no time for that at the moment. Let us compare them to something new instead.

    From SPSC to MPSC

    There's a few modifications required to make the SPSC implemented in previous posts into an MPSC. Significantly we need to control access to the tail such that publishers don't over write each others elements in the queue and are successful in incrementing the tail in a sequential manner. To do that we will:
    1. Have to replace the prev. lazy setting of the tail to it's new value (the privilege of single writers) with a CAS loop similar to the one employed in AtomicLong. 
    2. Once we successfully claimed our slot we will write to it. Note that this is changing the order of events to "claim then write" from "write then claim". 
    3. To ensure the orderly write of the element we will use a lazy set into the array
    Here's the code:

    I've dropped the use of a head cache, it's a pain to maintain across multiple threads. Lets start with this and consider reintroducing it later. In theory it should be a help as the queue is mostly empty.
    Because of the above reversal of writes we now must contend in the consumer with the possibility of the tail index being visible before the element is:
    1. Since the tail is no longer the definitive indicator of presence in the queue we can side step the issue by using the FastFlow algorithm for poll which simply tests the head element is not null without inspecting the tail counter. 
    2. Since the producers are interested in the value of head we must orderly publish it by using lazy set otherwise it will be open to be assigned to a register...

    The above code is worth working through and making sure you understand the reasoning behind every line (ask in the comments if it makes no sense). Hopefully I do too ;-). Was it worth it?

    We get some improvement beyond CLQ (x2.5 with 1 producer, x1.7-1.3 as more producers are added), and that is maintained as threads are added, but we are basically stuck on the same issue CLQ is as the producers pile up, namely that we are spinning around the CAS. These queue basically scale like AtomicLong increments from multiple threads, this has been discuss previously here, benchmarking a counter is an included sample in JMH so I took the opportunity to checkout the latest and greatest in that awesome project and just tweaked it to my needs. Here is what AtomicLong scales like:
    It's even worse than the queues at some point because the producer threads at least have other stuff to do apart from beating each other up. How can we contend with this issue?

    A CAS spin backoff strategy

    If you've used the Disruptor before you will find the idea familiar, instead of naively spinning we will allow some configuration of what to do when we are not getting our way, in the hope that time heals all things. I introduced the strategy in the form of an enum, but it's much of a muchness really:

    And this is what the offer looks like with the CAS miss strategy in place:

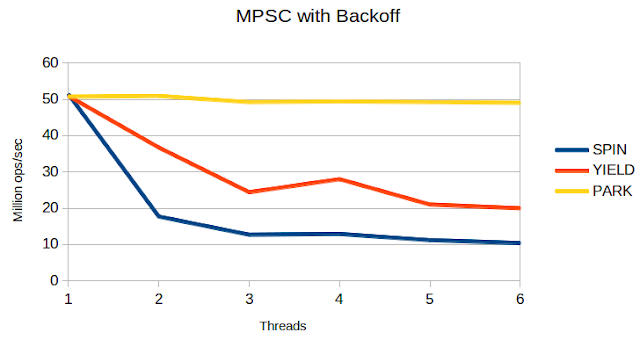
    There's a trade off here to be considered between a producers latency and the overall throughput of the system, I have not had time to experiment to that effect. Here's how the different back off strategies do:
    As we can see the Park strategy offers the best throughput and seems to maintain it as the number of threads increase. The end result is a fair consistent 50M ops/sec throughput.

    Notes and Reservations

    I've not had time yet to explore this queue/problem as much as I would like and as such this post should be seen a rough first stab rather than an accomplished summary. In particular:
    1. I'm unhappy with the benchmark/test harness. The producer threads are bound to start and stop out of sync with each other which will lead to uneven levels of contention on the queue. A better way to measure the throughput would require taking multiple samples during a run and discarding the samples where not all producers are offering.
    2. Given time I would have liked to test on larger producer counts, at the very least expanding the graphs to 20 or so producers.
    3. While running the benchmarks I encountered some run to run variation. A larger data set of runs would have been the right way to go.
    That said I think the result is interesting and I plan to explore further variations on this theme. In particular:
    1. An MPSC queue with looser FIFO requirements would allow much greater throughput. The challenges there are avoiding producer starvation and offering a degree of timeliness/fairness.
    2. In producing the MPSC queue I have taken another dive into the Disruptor code, a comparison between the Disruptor and the MPSC queue might prove interesting.
    Finally, I was intending to port some of these rough experiments into an open source collection of queues for general use (some readers expressed interest). This will happen in the near future, time and space permitting.


    SPSC IV - A look at BQueue

    $
    0
    0
    I thought I was done with SPSC queues, but it turns out they were not done with me...
    A kind reader, Rajiv Kurian, referred me to this interesting paper on an alternative SPSC implementation called BQueue. The paper compares the BQueue to a naive Lamport queue, the FastFlow queue and the MCRingBuffer queue and claims great performance improvements both in synthetic benchmarks and when utilised in a more real world application. I had a read, ported to Java and compared with my growing collection, here are my notes for your shared joy and bewilderment.

    Quick Summary of Paper Intro. Up To Implementation

    I enjoyed reading the paper, it's not a hard read if you have the time. If not, here's my brief notes (but read the original, really):
    • Some chit chat goes into why cross core queues are important - agreed.
    • Paper claims many SPSC queues perform very differently in a test-bed vs real world, in particular as real world applications tend to introduce cache traffic beyond the trivial experienced in naive benchmarking - I agree with the sentiment, but I think the "Real World" is a challenging thing to bring into your lab in any case. I would argue that a larger set of synthetic experiments would serve us all better in reviewing queue performance. I also admit my benchmarking thus far has not been anywhere rich enough to cover all I want it to cover. The application presented by the authors is a single sample of the rich ocean of applications out there, who's to say they have found the one shoe which fits all? Having said that, it still strikes me as a good way to benchmark and a valid sample to add to the general "your mileage may vary, measure with your own application" rule.
    • Existing queue implementations require configuration or deadlock prevention mechanisms and are therefore harder to use in a real application -While this argument is partially true for the solutions discussed thus far on this blog, I fear for best results some tuning has to be done in any case. In particular the solution presented by the paper still requires some configuration.
    • Examines Lamport and points out cache line thrashing is caused by cross checking the head/tail variables -  Code for the Lamport variation can be found here.  The variant put forward by Martin Thompson and previously discussed here (with code here) solves this issue by employing producer/consumer local caches of these values. This enhancement and a more involved discussion of cache coherency traffic involved is further discussed here.
    • Examines FastForward queue, which is superior to Lamport but - "cache thrashing still occurs if two buffer slots indexed by head and tail are located in the same cache line". To avoid this issue FF employs Temporal Slipping which is another way of saying a sleep in the consumer if the head/tail are too close. This technique leads to cache thrashing again, and the definition of too close is the configuration mentioned and resented above. - Right, I was not aware of temporal slipping, but I love the term! Next time I'm late anywhere I'll be sure to claim a temporal slippage. More seriously: this strikes me as a streaming biased solution, intentionally introducing latency as the queue becomes near empty/full. From the way it is presented in the article it is also unclear when this method is to be used, as it is obviously not desirable to inflict it on every call.
    • Examine MCRingBuffer, which is a mix of 2 techniques: head/tail caching (like the one employed by Mr. T) and producer batching. The discussion focuses on the issues with producer batching (producer waits for a local buffer to fill before actually writing anything to the queue), in particular the risk of deadlock between 2 threads communicating via such queues - I would have liked the discussion to explore the 2 optimisations separately. The head/tail cache is a very valid optimisation, the producer batching is very problematic due to the deadlock issue described, but also as it introduces arbitrary latency into the pipeline. Some variations on the queue interface support batching by allowing the publisher to 'flush' their write to the queue, which is an interesting feature in this context.
    • Some discussion of deadlock prevention techniques follows with the conclusion that they don't really work.

    Looking at the Implementation

    So I've been playing with SPSC queues for a while and recently wrote a post covering both the FastFlow queue and the use of sparse data to eliminate the near empty thrashing issue described above. I was curious to see a new algorithm so ported the algorithm from the paper to Java. Note the scary Unsafe use is in order to introduce the required memory barriers (not NOOPs!). Here is what the new algo brings to the table when written on top of my already existing SPSC queues code (code here):

    Changes I made to original (beyond porting to Java):
    • Renamed tail/head to be in line with my previous implementations.
    • Renamed the batch constants according to their use.
    • Left the modulo on capacity to the offset calculation and let the counters grow as per my previous implementations (helped me eliminate a bug in the original code).
    In a way it's a mix of the FastFlow(thread local use of counters, null check the buffer to verify offer/poll availability) and the MC/Mr.T solutions(use a cached look ahead index value we know to be available a write/read up to that value with no further checks), which I like (yay cross pollination/mongrels... if you are into any variation on racial purity try having children with your cousins and let me know how it went). The big difference lies in the way near empty/full condition are handled. Here's a few points on the algorithm:
    • The cached batchHead/Tail are used to eliminate some of the offer/poll need to null compare we have in FFBuffer. Instead of reading the tail/head every time we probe ahead on the queue. This counts on the null/not-null regions of the queue being continuous:
      • For the producer, if the entry N steps ahead of TAIL (as long as N is less than capacity) is null we can assume all entries up to that entry are also null (lines 4-11). 
      • Similarly we probe ahead as we approach the near empty state, but here we are looking for a not null entry. Given that the not null region is continuous, we probe into the queue ahead of the HEAD, if the entry is null then we have overshot the TAIL. If it is not null we can safely read up to that point with no further check.
    • The BQueue offers us a variation on the above mentioned temporal slip that involves the consumer doing a binary search for a successful probe until it hits the next batch size or declares the queue empty (lines 40 - 49). This is triggered every time the consumer needs to re-calculate the batchHead value having exhausted the known available slots.
    • Every poll probe failure is followed by a spinning wait (line 55-59).
    • Using the buffer elements as the indicator of availability allows the BQueue to avoid reverting to the cache thrashing caused by comparing and sharing the head/tail counters. 
    • The slowdown induced by the algorithm and the spinning wait allows the producer to build up further slack in the queue.  
    The temporal slip alternative is the main contribution celebrated in the paper, so it is worth comparing the code snippets offered for all variations.

    A Word On Benchmarking

    I ran the same benchmark I've been using all along to evaluate SPSC queues. It's synthetic and imperfect. The numbers you get in this benchmark are not the numbers you get in the real world. Your mileage is almost certain to vary. I've been getting some worried responses/twits/comments about this... so why do I use it? 
    • If you have been reading this series of posts you will see that the benchmark has been instrumental in identifying and measuring the differences between implementations, it's been good enough to provide evidence of progress or regression.
    • As a test harness it's been easy to use and examine via other tools. Printing out assembly, analysing hardware counter data, tweaking to a particular format: all easily done with a simple test harness. 
    It's imperfect, but practical. I'm increasingly uncomfortable with it as a benchmark because I don't feel the harness scales well to multi-producer examination and I'm in the process of implementing the benchmarks using JMH. As that work is not complete I use what I have.
    In the interest of completeness/open for review/honesty/general info, here is how I run benchmarks at the moment:
    1. I'm using my laptop, a Lenovo y510p. It's an i7-4700MQ.
    2. When running benchmarks I pin all running processes to core 0, then run my benchmarks on cores 1-7 (I avoid 1 if I can). It's not as good is isolcpus, but good enough for a quiet run IMHO.
    3. For this current batch of runs I also disabled the turbo-boost (set the frequency to 2.4GHz) to eliminate related variance. In the past I've left it on (careless, but it was not an issue at the time), summer is coming to South Africa and my machine overheats with it on.
    4. I'm running Ubuntu 13.10 64 bit, and using JDK7u45 also 64 bit.
    5. All the benchmarks were run with "-server -XX:+UseCondCardMark -XX:CompileThreshold=100000". I use these parameters for consistency with previous testing. In particular the UseCondCardMark is important in this context. See previous post for more in depth comparison of flags impact on performance.
    6. For this set of results I only examined the cross core behaviour, so the runs were pinned to core 3,7
    7. I do 30 runs of each benchmarks to get an idea of run to run variance.
    I include the above as an open invitation for correction and to enable others to reproduce the results should they wish. If anyone has the time and inclination to run the same benchmarks on their own setup and wants to share the data I'd be very interested. If anyone has a suite of queue benchmarks they want to share, that would be great too.
    As for the validity of the results as an indication of real world performance... the only indication of real world performance is performance in the real world. Having said that, some problems can be classified as performance bugs and I would argue that false-sharing, and bad choice of instructions falls under that category. All other things being equal I'd expect the same algorithm to perform better when implemented such that it's performance is optimal.


    Taking BQueue for a Spin  

    And how does it perform? It depends... on  the configuration(what? but they said?! what?). There are 3 parameters to tune in this algorithm:
    1. TICKS - how long to spin for when poll probing fails.
    2. POLL_MAX_BATCH_SIZE - the limit, and initial value for the poll probe.
    3. OFFER_BATCH_SIZE - how far to probe for offer, also note that OFFER_BATCH_SIZE elements will remain unused of the queue capacity (i.e the queue can only fit [capacity - OFFER_BATCH_SIZE] elements before offer fails).
    I played around with the parameters to find a good spot, here's some variations (see the legend for parameters, X is run number, Y is ops/sec):
    1. There's no point in setting the batch sizes lower than 32 (that's 2 cache lines in compressed OOPS references) as we are trying to avoid contention. Also, it'll just end up being a confusing branch for the CPU to hit on and the whole point of batching is to get some amortized cost out of it. Even with batch sizes set as low as 32 for both the queue performs well (median is around 261M) but with significant variance.
    2. Upper left chart shows the results as the offer batch is extended (poll batch remains at 32). The larger offer batch offers an improvement. Note that extending the offer batch only gives opportunity for the producer to overtake the consumer as the consumer hits the poll probing logic every 32 steps. A large slack in the queue allows the best throughput (assuming consumer is mostly catching up). The variance also decreases as the offer batch is increased.
    3. Upper right chart shows the results for increasing the poll batch (offer batch remains at 32). As we can see this actually results in worse variance.
    4. Increasing both the offer and the batch size in step (lower left chart) ends up with better overall results, but still quite significant variance
    5. Keeping the offer/poll batch at 8k I varied the spin period which again results in a different profile, but no cure to variance.
    For context here is the BQ result (I picked the relatively stable 80,32,8k run) compared with the FFBuffer port and my inlined counters variation on Thompson/Lamport with and without sparse data(Y8=inlined counters,the square brackets are parameters, for FF/Y8 it is the sparse shift so 2 means use every 4th reference):
    [NOTE: previous benchmarks for same queues were run with turbo boost on, leading to better but less stable results, please keep in mind when considering previous posts]
    As you can see the BQueue certainly kicks ass when compared to the non-sparse data variations, but is less impressive when sparse data is used. Note that BQueue manages to achieve this result with far less memory as it still packs the references densely (note that some memory still goes wasted as mentioned above, but not as much as in the sparse data variations).What I read into the above results:
    1. This algorithm tackles the nearly empty/full queue in an appealing manner. Probing the queue to discover availability is also a means of touching the queue ahead and bringing some required data into the cache.
    2. The main reason for the speed up is the slowing down of the consumer when approaching empty. This serves as a neat solution for a queue that is under constant pressure.
    3. The spinning wait between probes presents a potentially unacceptable behaviour. Consider for instance a consumer who is sampling this queue for data, but needs to get on with other stuff should it find it empty. Alternatively consider a low latency application with bursty traffic such that queues are nearly empty most of the time. 
    4. I'll be posting a further post on latency benchmarking the queues, but currently the results I see (across cores, implementing ping pong with in/out queue) suggest the FF queue offers the best latency(200ns RTT), followed by Y8(300ns) and the BQueue coming in last(750ns). I expect the results to be worst with bursty traffic preventing the batch history from correctly predicting a poll batch size.


    Summary

    This is an interesting queue/paper to me, importantly because it highlights 2 very valid issues:
    1. Near empty/full queue contention is a significant concern in the design of queues and solving it can bring large performance gains to throughput.
    2. Real application benefits may well differ from synthetic benchmark benefits. To support better decision making a wider variety of tests and contexts needs to be looked at.
    I think the end solution is appropriate for applications which are willing to accept the latency penalty incurred by the consumer when hitting a nearly empty queue.  The near full queue guard implemented for this queue can benefit other queue implementations and has no downside that I can see beyond a moderate amount of wasted space. 
      Thanks again to Rajiv Kurian for the pointer to this queue, and Norman M. for his help in reviewing this post.


      Announcing the JAQ(Java Alternative Queues) Project

      $
      0
      0
      To quote Confucius:
      "To learn and then practice it time and again is a pleasure, is it not? To have friends come from afar to share each others learning is a pleasure, is it not? To be unperturbed when not appreciated by others is gentlemanly, is it not?" - Analects 1:1
      It is obvious to me the old man was talking about open source software, where we repeat what we learn, share with friends from afar, and try and behave when no one seems to get it. In this spirit I am going to try and apply lessons learnt and put together a concurrent queues library for Java - Java Alternative Queues.
      It's early stages, but at this point I would value some feedback on:
      1. Intentions
      2. Interfaces and usability
      3. Project roadmap


      Intentions

      When concurrent queues are concerned, it is my opinion that the JDK offering has been robust, but too generic to benefit from the performance gains offered by a more explicit declaration of requirements. JAQ would tackle this by providing queues through a requirements focused factory interface allowing the user to specify upfront:
      1. Number of producers/consumers
      2. Growth: Bounded/Unbounded
      3. Ordering (FIFO/other)
      4. Size
      5. Prefer throughput/latency
      To see a wider taxonomy of queues see 1024Cores.net excellent analysis. At this point all the queues I plan to implement are non-blocking and lock-free as my main interest lies in that direction, but many of the principals may hold for blocking implementations and those may get added in the future.


      Interfaces and Usability

      I like the idea of separating several entities here:
      • ConcurrentQueueFactory - Tell me what you need, through a ConcurrentQueueSpec.
      • ConcurrentQueue - The queue data structure, provided by the factory. At the moment it does nothing but hand out producer/consumer instances. This is where pesky methods such as size/contains may end up. I'm not keen on supporting the full Queue interface so feedback on what people consider essential will be good.
      • ConcurrentQueueConsumer - A consumer interface into the queue, provided by the queue. I'm planning to support several consumption styles,.
      • ConcurrentQueueProducer - A producer interface into the queue, provided by the queue.
      The producer/consumer instances are thread specific and the appropriate thread should call into the queue provider method. Here is the old QueuePerfTest converted to use the new interface (I cleared out the irrelevant cruft for timing this and that):

      I realize this goes against the current Queue interface, but part of the whole point here is that the more we know about the calling code the better performance/correctness we can hope to offer.

      Roadmap

      I'd like to tackle the work in roughly the following order:
      • Specify/document/settle on high level interfaces (initial cut done)
      • SPSC implementations/tests/benchmarks (good bounded SPSC implementation is done, some benchmarks)
      • MPSC implementations/tests/benchmarks (some bounded MPSC variants are included but not integrated)
      • SPMC implementations/tests/benchmarks (not started)
      • MPMC implementations/tests/benchmarks (not started)
      There's more I want to do in this area, but the above will keep me busy for a while so I'll start with that and increase the scope when it reaches a satisfying state.
      I'm using JMH (and getting valuable support from @shipilev) for benchmarking the queues and hoping to use JCStress to test multi-threaded correctness. 


      Contributors/Interested Parties

      I know I'll be using this library in the near future for a few projects, but I hope it will be generally useful so your feedback, comments and observations are very welcome. I've not been involved much in open-source projects before, so any advise on project setup is also welcome. Finally, if you feel like wading in and cutting some code, adding some tests or benchmarks, reporting some bugs or expressing interest in features BRING IT ON  :-) pull requests are very welcome.

      JAQ: Using JMH to Benchmark SPSC Queues Latency - Part I

      $
      0
      0
      As part of the whole JAQ venture I decided to use the excellent JMH (Java Microbenchmark Harness see: project here, introduction to JMH here, and multi-threaded benchmarking here). The reason I chose JMH is because I believe hand rolled benchmarks limit our ability to peer review and picking a solid framework allows me and collaborators to focus on the experiment rather than the validity of the harness. One of the deciding factors for me was JMHs focus on multi-threaded benchmarks, which is something I've not seen done by other frameworks and which forms it's own set of problems to the aspiring benchmarker. It's not perfect, but it's the closest we have.
      Anyways... that's the choice for now, lets jump into some benchmarks!

      Using the JMH Control

      To benchmark the latency of 2 threads communicating via a queue requires using the JMH Control structure. This is demonstrated in the JMH samples measuring thread to thread "ping pong" via an AtomicBoolean.compareAndSwap (see original here):

      The challenge here is that the CAS operation may fail, and when it does we would want to retry until we succeed, BUT if the opposite thread were to be stopped/suspended because the benchmark iteration is done we would be stuck in an infinite loop. To avoid this issue a benchmarked method can have a Control parameter passed in which exposes a flag indicating the end of a run, this flag can be used to determine benchmark termination and thus avoid the above issue. You'll notice other JMH annotations are in use above:
      • State: sets the scope of the benchmark state, in this case the Group
      • Group: multi-threaded benchmarks can utilize thread groups of different sizes to exercise concurrent data structure with different operations. In the case above we see one group calls pingpong. Both methods are exercised by threads from the group, using the default of 1 thread per operation.
      • Note that if we were to run the above benchmark with more threads, we will be running several independent groups. Running with 10 threads will result in 5 concurrent benchmark runs each with it's own group of 2 threads.
      I pretty much copied this benchmark into the jaq-benchmarks and refer to it as a baseline for inter-thread message exchange latency. The results for this benchmark are as follows (running on the same core):
      Benchmark                                  Mode Thr     Count  Sec         Mean   Mean error    Units
      i.j.s.l.BaselinePingPong.pingpong          avgt   2        10    1       23.578        0.198    ns/op
      i.j.s.l.BaselinePingPong.pingpong:ping     avgt   2        10    1       23.578        0.198    ns/op
      i.j.s.l.BaselinePingPong.pingpong:pong     avgt   2        10    1       23.578        0.198    ns/op

      And running across different cores:
      Benchmark                                  Mode Thr     Count  Sec         Mean   Mean error    Units
      i.j.s.l.BaselinePingPong.pingpong          avgt   2        10    1       60.508        0.217    ns/op
      i.j.s.l.BaselinePingPong.pingpong:ping     avgt   2        10    1       60.496        0.195    ns/op
      i.j.s.l.BaselinePingPong.pingpong:pong     avgt   2        10    1       60.520        0.248    ns/op


      The way I read it CAS is sort of a round trip to memory, reading and comparing the current value, and setting it to a new value. You could argue that it's only a one way trip, and I can see merit in that argument as well. The point is, these are the ballpark figures. We shouldn't be able to beat this score, but if we manage to get close we are doing well.
      Note from a hardware point of view: See this answer on Intel forums on cache latencies. Latencies stand at roughly:
      "L1 CACHE hit, ~4 cycles
       L2 CACHE hit, ~10 cycles
       L3 CACHE hit, line unshared ~40 cycles
       L3 CACHE hit, shared line in another core ~65 cycles
       L3 CACHE hit, modified in another core ~75 cycles
       remote L3 CACHE ~100-300 cycles
       Local Dram ~60 ns
       Remote Dram ~100 ns"
      To convert cycles to time you need to divide by your CPU clock speed, the delay manifestation will also be dependant on whether or not you require the data to make progress etc. The thing to keep in mind here is that there is a physical limit to the achievable latency. If you think you're going faster... check again ;-). 

      Queue round trip latency benchmark

      Queues are not about exchanging a single message, they are about exchanging many messages asynchronously (at least that's what the queues I care about are about). Exchanging a single message is a worst case scenario for a queue, there's no gain to be had by batching, no false sharing to avoid, nothing much to cache, very little cost to amortize. It is therefore a valuable edge case, and an important one for many real world applications where latency needs to be minimized for bursty traffic/load. To put my queues to the test I devised a round trip benchmark which allows us to chain a configurable number of threads into a ring and measure the round trip latency. This should help magnify the exchange costs and perhaps expose behaviours not so easily detected in the minimal case. Here's an outline of the functionality under test given a chain length N (which requires N queues and N threads including the measuring thread) and a burst of K messages:
      1. From thread[0] send K objects down queue[0].
      2. Concurrently: In each thread K(0<K<N) read from queue[K-1] and write to queue[K].
      3. Thread[0] waits for K objects to be polled from queue[N-1] and returns.
      There were several challenges/intricacies to be considered here:
      • The number of benchmarking threads is unknown at runtime (in JMH), so chain length must be defined separately.
      • Setup/Teardown methods on the Iteration level are called per thread.
      • Thread state is allocated and used per thread per iteration. The threads are pooled, so a given thread can switch 'roles' on each iteration. In other words @State(Scope.Thread) is not ThreadLocal.
      • Concurrent polls to SPSC queues can leave the queue in an undefined state.
      • The benchmark requires that the queues are empty when we start measuring, so at the beginning or end of an iteration we must clear the queues.
      • Queues must be cleared from the consumer thread.
      So things are not that simple, and the code (full code here) is an attempt to cover all these intricacies:

      I'm relying on correct usage for some things, but JMH is basically doing most of the heavy lifting:
      • JMH is taking care of all the measurements/measurement modes/reporting/formatting including forked runs and stats summaries and all.
      • JMH is taking care of thread management, no need to spin up threads/executors and shut them down.
      • JMH is synchronizing iterations and managing per thread state setup/teardown. Note the @TearDown annotation in Link/Source.
      • JMH is allowing the group thread balance to be parametrized (just recently) which allows generic asymmetric multi-threaded benchmarks like the above.
      Where I have to work around the framework:
      • I would like to only specify the chain.length and derive the thread allocation from that. This is possible via the JMH launcher API.
      • I would like @State(Scope.Thread) to mean ThreadLocal.
      • I would like to be able to pass State down the stack as constructor parameters, so I could avoid the static field for sharing benchmark state between thread state objects.
      I'd be lying if I said writing this benchmark the JMH way was easier than hacking something together, it take getting used to and some of the features I required are fairly late additions. But the benefit is worth it.
      I can't stress this point enough, the objective here is more than collecting data, it is about enabling, supporting and empowering peer review. I want the benchmarks to be as simple as they can be so people can either be easily convinced or easily point out my errors. The less code I need my peers to read, the easier it is for anyone to build/run/tweak the benchmarks, the less we rely on handrolled/halfassed attempts at benchmark frameworks THE BETTER (having said that, you got to do what you got to do). 
      Note: If you care about latency you should watch Gil Tene's excellent talk on How Not To Measure Latency, where he discusses coordinated omission and it's impact on latency measurement. As you may have noticed this experiment suffers from coordinated omission.  I'll have to live with that for now, but I don't feel the data gained from a corrected measurement would impact the queue implementations in any form.

      Hard Numbers? Numbers Hard?

      We've got the following queues:
      1. ConcurrentLinkedQueue (CLQ) - Good old JDK lock free queue, for reference. 
      2. InlinedCountersSpscConcurrentArrayQueue (CAQ) - My inlined counter variation on Martin Thompson's ConcurrentArrayQueue previously discussed/explained/explored here and compared to this variation here. It can be run with sparse data as described here.
      3. FFBuffer (FF1) - A Java port of the FastFlow SPSC implementation with sparse data as described here.
      4. BQueue (BQ)- An SPSC previously discussed here which introduces an offer side batch of the null check (which also serves as a full queue induced false sharing protection) and a poll side batching of emptiness testing which also includes a spinning backoff to avoid the near empty queue issue.
      5. FFBufferWithOfferBatch (FF2) - A BQueue on the offer side and an FFBuffer on the poll side, this is a new addition to the arsenal.
      JMH gives us 2 relevant benchmark modes for the above use case:
      1. AverageTime - Average time per operation (from the command line use '-bm avgt')
      2. SampleTime - Time distribution, percentile estimation (from the command line use '-bm sample')
      And we could also look at the same core vs. cross core latency, vary the length of the chain and examine the effect of sparse data on latency. This is a bit of an explosion of data, too much for one post, but lets dip our toes...
      I'll start with the average RTT latency for each type, running same core and cross core:

      The benchmarks were run on my laptop (JDK7u45/Ubuntu13.10/i7-4700MQ@2.40GHz no turbo boost/benchmark process pinned using taskset) and though I ran them repeatedly I didn't systematically collect run to run variance data, so consider the results subject to some potential run to run variance.
      As we can see:
      • FF2/FF1 are very similar and take the cake at 60/230ns (FF2 is marginally faster).
      • BQ is the worst [392/936ns] because of its backoff on approaching near empty strategy.
      • It is perhaps surprising to see that although CAQ/FF1/BQ show very similar throughput in my previous tests their latency characteristics are so distinct.
      • Note that CLQ is actually not too bad latency wise (in this particular use case). 
      Lets have a look at what happen when the burst size increases[I dropped FF1 out of the race here, too similar to FF2, this is running across cores]:
      We can see that:
      • CLQ makes no effort to amortize costs as its RTT grows with the burst size.
      • BQ starts off as the worst, but somewhere between burst size 16 and 32 the benefits of it's design start to show.
      • FF2 and CAQ demonstrate similar growth patterns with the cost per item dropping as the burst size grows. But FF2 remains the clear winner, at burst size 32 the round trip is 640ns.
      • 640ns for 32 messages averages at just 20ns per message. This is NOT A MEANINGFUL LATENCY NUMBER! :) 

        Latency != Time/Throughput

        Let me elaborate on this last point. The average cost is not a good representative of the latency. Why not? latency in this case is the round trip time from each message perspective, throughput in a concurrent environment is not an indicator of latency because it assumes a uniformity that is just not there in real life. We know the behaviour for the first message is at best the same, so assuming first message latency is 230ns, how would the other messages timeline need to look to make the mean latency 20ns? is that reasonable? What is really happening here is as follows (my understanding in any case):
        • Producer pretty much writes all the messages into the queue in one go within a few nano-seconds of first and last message being written. So if we mark T1..T32 the send time of the messages, we can estimate T32 - T1 is within 100ns - 150ns (single threaded read/write to FF2 takes roughly 6ns, assume an even split between write and read and add some margin). Near empty queue contention can add to this cost, or any direct contention between poll/offer.
        • In fact, assuming a baseline cost of 6ns read/write, multiplied by chain length, leads to a base cost of 32*6*2=384ns. Following from this is that the minimum latency experienced by any message can never be less than 32*3=96ns as the burst must be sent before messages are received.  96ns is assuming zero cost for the link, this is how fast this would go offering and polling from the same queue in the same thread.
        • With any luck, and depending on the size of the burst, the consumer will see all the messages written by the time it detects data in the queue (i.e. it won't contend with the producer). There is opportunity here for reduced cost which is used by FF2/CAQ and BQ.
        • The consumer now reads from the queue, the first message is detected like it would for burst size 1, i.e after 115ns or so for FF2. This can only get worse with the contention of potentially other messages being written as the first message is read adding further latency. The rest of the messages are then read and there is again an opportunity to  lower costs. The messages are written into the outbound queue as soon as they are read. Reading and writing each message has a cost, which we can assume is at the very least as high as 6ns.
        • The producer now detects the messages coming back. Let's mark the return times for the messages R1-R32. We know T1 - R1 is at least 230ns and we know that T1 - R32 is roughly 640ns. Assuming some fixed costs for writing/reading from the queue, we can estimate that R32-R1 is also within 100-150ns.
        • So, working through the timeline as estimated above gives us the following best case scenario for message 32:
          • 3ns     - Source sends message 1
          • 96ns   -  Source sends message 32
          • 115ns - Link picks up message number 1, has to work through messages 1-31
          • 230ns - Source picks up message 1
          • 301ns - Link is done transferring 31 messages and is finally picking up message 32
          • 307ns - Link has sent message 32
          • 346ns - Source has finished processing message 32
        • In this hypothetical best case scenario, message 32 which had the best chance of improved latency enjoyed a 150ns RTT. This is the theoretical best case ever. IT DIDN'T HAPPEN. The RTT we saw for a 32 messages burst was 640ns, indicating some contention and an imperfect world. A world in which there's every chance message 32 didn't have a latency as good as message 1.
        • The fallacy of the average latency is that it assumes a uniform distribution of the send and receive times, but the reality is that the groups are probably lumped together on a timeline leading to many send times being within a few ns of each other, and many receive times being within a few ns of each other. This is the magic of buffering/queuing.
        • The latency experienced by the last element in a burst can be better than the latency experienced by the first, but not significantly so and subject to some very delicate timing. The important thing here is that good queues allow the producer to make progress as the consumer idles or is busy consuming previous items, thus allowing us to capitalize on concurrent processing.

        To Be Continued...

        There's allot of experimentation and data to be had here, so in the interest of making progress with the project as well as sharing the results I'll cut this analysis short and continue some other time. To be explored in further posts:
        • Compare sparse data impact on CAQ/FF2 for the bursty use case - I have done some experimentation which suggests FF2 gains little from the sparse data setting, while for CAQ the improvements are noticeable for certain burst sizes.
        • Compare average time results with the sampling mode results - There are significant differences in the results, which I'm still trying to explain. One would expect the sampling mode to have some fixed overhead of having to call System.nanoTime() twice for each sample, but the difference I see is an x2 increase in the mean.
        • Compare queue behaviour for different chain lengths - The results are unstable at the moment because the thread layout is not fixed. For chain length 2-4 the topography can be made static, but from chain size 5 and up the number of cross core crossings can change in mid run (on my hyper threaded quad core anyways), leading to great variance in results (which is legitimate, but annoying). I will need to pin threads and thread 'roles' to stabilize the benchmark for this use case, probably using JTA (Java Thread Affinity - by Sir Lawrey).
        The overall result is pointing to FF2 as the clear winner of the fastest queue competition, but the variety is educational and different designs are useful for different things. This also strengthens my conviction that a requirement based factory for queues serves your code much better than naming the queue flavour you feel like as you code. All the more reason to invest more time into JAQ :-).

        Thanks to Darach, Norman, and Peter for reviewing the post, and Aleksey for reviewing the benchmark. Peer review FTW!

        JAQ: Using JMH to Benchmark SPSC Queues Latency - Part II

        $
        0
        0
        Just quickly sharing more results/insights from running different configuration of the SPSC latency benchmark discussed in the previous post. The previous post reviewed the different implementations behaviour when sending different sizes of bursts, in this post I'll have a look at the impact of the length of the chain (number of threads passing the messages from one to the other returning to the originator) on latency. The benchmarks and queues stay the same, so you may have to skip back to the previous post for context.

        TL;DR

        This post may not be of great popular appeal... it's a verification of the behaviour of current implementations of SPSC in terms of single threaded operation costs and RTT latency for different 'trip' lengths. The main finding of interest (for me) is that the sparse data method previously discussed here is proving to be a hindrance to latency performance. This finding is discussed briefly at the end and is something I may dig into more deeply in the near future. Other more minor nuggets were found... but anyhow, lets get to it. 

        Chain length 1: The cost of talking to yourself

        When I had Darach review the original post he pointed out to me that I neglected to cover this edge case in which a queue is being used by a single thread acting as both the consumer and the producer. The result is interesting as a baseline of operation costs when no concurrency is involved. The benchmark is very simple:


        The results give us a sense of the cost of [(offer * burst size) + (poll * burst size)] for the different implementations. I added one of my favourite collections, the ArrayDequeue, to compare the efficiency of a non-thread safe queue implementation with my furry gremlins. Here's the score for AD vs CLQ for the different burst sizes:

        This is a bit of a bland presentation, so feel free to call me names (you bland representor of numbers!). The numbers are here if you want to play. All the numbers are in nanos per op, mean error in brackets. Benchmark run on laptop(Ubuntu13.10/JDK7u45/i7-4700MQ@2.4 capped). Here's the score for CAQ/FF2 with sparse shift set to 0 and 2:


        Points for consideration:
        • CLQ (ConcurrentLinkedQueue) is the worst. This is completely the wrong tool for the job which is why this result should be a lesson in why using concurrent data structures where you don't need them will suck.
        • Overall AD(ArrayDequeue) is the best from burst size 4 and up. This is the right tool for the job when your consumer and producer are the same thread. Choose the right tool, get the right result.
        • CAQ(ConcurrentArrayQueue) and FF2(FFBufferWithOfferBatch) start off as similar or better than AD, but soon fall behind. Interestingly FF2 starts as the winner of the 3 and ends as the loser with CAQ overtaking it from burst size 64 and onward.

        I found it interesting to see how the behaviour changed as the burst size changes, and I thought the single threaded cost estimates were valuable as enablers of other estimates, but overall this is not a benchmark to lose sleep over.
        Note the CAQ/FF2 are measured in 2 configurations with and without sparse data. The use of sparse data is counter productive in this use case as it aims to reduce contention that is not there, and inhibits throughput in the process.

        Stable Chains: Working across the cores

        Due to the limits of my benchmarking machine I can only demonstrate stable behaviour for chains of length 1 to 4 without resorting to pinning threads to cores. Still, the results offer some insight. The benchmark in use is the one discussed previously here. The whole process is pinned such that the only available inter-thread channel is across cores. On my machine I have a hyper-threaded quad-core CPU so 8 logical cores from a taskset perspective. The even/odd numbers are on different cores. For my runs I pinned all other processes to core 0 and pinned the JMH process to different cores (as many as I needed from 1,3,5,7). This is not ideal, but is workable.
        I didn't bother with CLQ for this set of results. Just CAQ and FF2. The benchmark code is here.
        Here's chain length 2 (T1 -> T2 -> T1):


        Here's chain length 3 (T1 -> T2 -> T3 -> T1):

        Here's chain length 4 (T1 -> T2 -> T3 -> T4 -> T1):


        This is data collected from (10 warmup iterations + 10 iterations) * 10 forks, so benchmarking took a while. This should mean the data is slightly more than anecdotal...
        Conclusions:

        • FF2 is consistent proving to be the best queue in terms of inter-thread latency. This advantage is maintained for all burst sizes and chain lengths.
        • Sparse data is only marginally improving results consistently for burst size 1. After that it seems to have a small positive effect on CAQ with chain length 3/4 with small bursts. This may be a quirk of the use case demonstrated by the benchmark but it at least shows this method has a demonstrable down side.
        • The burst RTT does not grow linearly with the burst size, in particular for the smaller bursts. This is due to the bursts filling up the time-to-notify period with write activity.
        Here's the latency for FF2(sparse=0) across all chains:

        • Single threaded cost grows linearly with size, this is how we are used to think about cost. It's also a lower boundary for the round trip use case as the round trip requires at least the amount of work done in the single thread case to still be done in the measuring/source thread.
        • Once we increase the chain length we get this initial plateau steadily increasing in slope to become linear again. Note that for the 2 threaded case the costs are nearly the same as the single thread case from burst size 512.

        Where to next?

        I've had a long break over Xmas, some progress was made on JAQ, but not as much as I'd have liked... I actually spent most of the time away from a keyboard. There are now MPSC/SPMC implementations, and a direct ConcurrentQueue implementation for SPSC hooked into the factory and an MPSC one nearing completion. I've had some interest from different people and am working towards meeting their requirements/needs... we'll get there eventually :-)

        Thanks Norman M. for his review (he did tell me to add graphs... my bad)

        Picking the 2013 SPSC queue champion: benchmarking woes

        $
        0
        0
        I put FFBufferWithOfferBatch together as part of looking into the performance of BQueue and what with all the excitement about JAQ I never introduced it properly. As it's the best performing SPSC(Single Producer Single Consumer) queue I have thus far I thought I should quickly cover it and tell you some horrific benchmarking tales of how I determined it's the best thus far.

        Offer like a BQueue

        The BQueue was previously presented and discussed here. Offer logic is simple and improves on the original FFBuffer by ensuring clearance to write ahead for the next OFFER_BATCH_SIZE elements. This improvement has 3 effects:
        1. Most of the time we can write without reading and checking for null. We do one volatile read for every OFFER_BATCH_SIZE elements, the rest of the time we compare to the cached field which is a normal field that can be held in a register.
        2. We avoid hitting the full queue induced contention by keeping a certain distance from the head of the queue. Contention can still happen, but it should be quite rare.
        3. We potentially miss out on part of the queue capacity as we will declare the queue full if there are less than OFFER_BATCH_SIZE available when we hit the cached value.https://twitter.com/peterhughesdev
        Overall this is not a bad deal.

        Poll like an FFBuffer

        This poll method is again quite simple. Offset hides the sparse data shift trick that is discussed in depth here. The sparse data trick is a way of reducing contention when nearing the empty queue state. With a sparse shift of 2 only 4 elements in the queue buffer actually share the same cache line (as opposed to 16 when data is not sparse) reducing the frequency with which that state occurs. This has a side effect of hurting memory throughput as each cache line we load has less data in it.

        Benchmarks: A Misery Wrapped In An Enema

        I've been benchmarking these queues over a long period of time and it is a learning experience (i.e: very painful). Benchmarking is just generally a complex matter, but when it comes to examining and comparing code where a single operation (offer/poll) is in the nano-seconds I quote Mr. Shipilev: "nano-benchmarks are the damned beasts". Now, consider a multi-threaded nano-benchmark...
        Let's start with naming the contestants:
        Now, the first benchmark I used to quantify the performance of these queues was the one I got from Martin's examples project. I stuck with it for consistency (some cosmetic changes perhaps), though I had some reservations about the section under measurement. Here's how the measured section goes:

        The benchmark measures the time it takes for REPETITIONS number of 'messages' to be sent from the producer to the consumer. If the consumer find that the queue is empty it will Thread.yield and try again, similarly if the producer finds that the queue is full it will Thread.yield and try again.
        Here's how the queues perform with that benchmark (running on Ubuntu13.10/JDK7u45/i7-4300MQ@2.4 no turbo boost, pinned across cores using taskset, with JVM options: '-server -XX:+UseCondCardMark -XX:CompileThreshold=100000'):
          CAQ(sparse=0) - 130M ops/sec
          FF1(sparse=0) - 155M ops/sec
          FF2(sparse=0) - 185M ops/sec
          CAQ(sparse=2) - 288M ops/sec
          FF1(sparse=2) - 282M ops/sec
          FF2(sparse=2) - 290M ops/sec

        When I started on JAQ I took the same benchmark, but changed a few things. I moved the start timestamp to the producing thread and moved the thread join out of the measured section, I also added some counters for when the producer fails to offer (queue is full) and the consumer fails to poll (queue is empty). Finally I took this same benchmark and ported it to use my very own ConcurrentQueue interface. Here's how it looked:

        You would think this sort of change could only make performance slightly worse, if it made any difference at all. Certainly that's what I thought, but I was wrong... With the new benchmark I got the following results:
          FF2(sparse=0) - 345M ops/sec
          FF2(sparse=2) - 327M ops/sec


        WTF? What is the difference?

        I looked long and hard at the benchmark and realized the only difference, that shouldn't really make a difference, but the only difference that does make a difference is the localization of the queue field to the producer loop (found by process of elimination). Tweaking the original benchmark to localize the queue reference gives us different results for all queues:
          CAQ(sparse=0) - 291M ops/sec
          FF1(sparse=0) - 190M ops/sec
          FF2(sparse=0) - 348M ops/sec
          CAQ(sparse=2) - 303M ops/sec
          FF1(sparse=2) - 287M ops/sec
          FF2(sparse=2) - 330M ops/sec

        So we notice things have not improved much for FF1, but for CAQ we now have only a marginal difference between using sparse data and not using it, and for FF2 it is actually better not to bother at all with sparse data. The localization of the queue reference made the producer faster, reducing the number of times the empty queue state is hit and thus reducing the need for sparse data. We can try to validate this claim by running the Queue variation of this benchmark with the counters. With the reference localized:
          CAQ(sparse=0) - 291M ops/sec, poll fails 350,    offer fails 0
          FF1(sparse=0) - 192M ops/sec, poll fails 32000,  offer fails 0
          FF2(sparse=0) - 348M ops/sec, poll fails 150,    offer fails 13000
          CAQ(sparse=2) - 303M ops/sec, poll fails 270,    offer fails 0
          FF1(sparse=2) - 287M ops/sec, poll fails 200,    offer fails 0
          FF2(sparse=2) - 330M ops/sec, poll fails 170,    offer fails 10

        So we can see that adding the extra counters made little difference with the reference localized, but when referencing the field directly in the producer loop:
          CAQ(sparse=0) - 167M ops/sec, poll fails 2400,   offer fails 0
          FF1(sparse=0) - 160M ops/sec, poll fails 100000, offer fails 0
          FF2(sparse=0) - 220M ops/sec, poll fails 2000,   offer fails 0
          CAQ(sparse=2) - 164M ops/sec, poll fails 31000,  offer fails 0
          FF1(sparse=2) - 250M ops/sec, poll fails 2000,   offer fails 0
          FF2(sparse=2) - 255M ops/sec, poll fails 500,    offer fails 0

        We get a different picture again, in particular for CAQ. To get to the bottom of the exact effect localizing the reference had on this benchmark I will have to dig into the generated assembly. This will have to wait for another post...


        Conclusions And Confusions

        The overall winner, with all the different variations on the throughput benchmarks, is the FFBufferWithOfferBatch. It's also the winner of the previously presented/discussed latency benchmarks(part 1, part 2). With turbo boost on it hits a remarkable high of 470M ops/sec. But setting this result to one side, the above results highlight a flaw in the throughput benchmark that is worth considering in the context of other concurrent benchmarks, namely that changing the [queue] implementation under test can change the benchmark.
        Let me elaborate on this last point. What I read into the results above is that the benchmark was initially a benchmark where the queue full state was never hit, and the queue empty state was hit more or less depending on the queue implementation. Given FF2 is only a change to the offer method of FF1 we can see how tilting the balance between the offer cost and poll cost changed the nature of the test. In particular when using no sparse data the producer turned out to be significantly faster than the consumer. But... in changing the implementation we have unbalanced the benchmark, it is hardly ever hitting an empty queue, which would slow down the consumer/producer threads. We have switched to measuring the full speed of consumption as a bottleneck, but only for one queue implementation. So this is, in a way, not the same benchmark for all queues.
        While this benchmark is still useful to my mind, it is worth considering that it is in fact benchmarking different use cases for different queues and that the behaviour of the using code will inevitably balance the producer/consumer costs quite differently. All in all, yet another case of your mileage may vary ;-)

        Thanks to Peter, Darach and Mr. Gomez

        When I say final, I mean FINAL!

        $
        0
        0
        Having recently bitched about the lack of treatment of final field as final I was urged by Mr. Shipilev to demonstrate the issue in a more structured way (as opposed to a drunken slurred rant), I have now recovered my senses to do just that. The benchmark being run and the queue being discussed are covered in this post, so please refresh you memory for context if you need. The point is clear enough without full understanding of the context though.
        It is perhaps a fact well known to those who know it well that final fields, while providing memory visibility guarantees, are not actually immutable. One can always use reflection, or Unsafe, to store new values into those fields, and in fact many people do (and Cliff Click hates them and wishes them many nasty things). This is (I believe) the reason behind some seemingly trivial optimizations not being done by the JIT compiler.

        Code Under Test: FFBufferWithOfferBatch.poll()

        The buffer field is a final field of FFBufferWithOfferBatch and is being accessed twice in the method above. A trivial optimization on the JIT compiler side would be to load it once into a register and reuse the value. It is 'immutable' after all. But if we look at the generate assembly (here's how to, I also took the opportunity to try out JITWatch which is brilliant):
        We can see buffer is getting loaded twice (line 15, and again at line 24). Why doesn't JIT do the optimization? I'm not sure... it may be due to the volatile load forcing a load order that could in theory require the 'new' value in buffer to be made visible... I don't know.

        Hack around it, see if it makes a difference

        Is that a big deal? Let's find out. The fix is trivial:
        And the assembly code generated demonstrates the right behaviour now (one load at line 15):
        Now, was that so hard to do? And more importantly, does it make any difference to performance? As discussed previously, the throughput benchmark is sensitive to changes in the cost balance between offer/poll. The optimization creates an interesting change in the pattern of the results:
        The benchmark is run on Ubuntu13.10/JDK7u45/i7@2.4, the x axis is the index of the benchmark run and the Y axis is the result in ops/sec. The chart displays the results for before the change (B-*) and after(A-*) with different sparse data settings. We can see the change has accelerated the consumer, leading to increased benefit from sparse data that was not visible before. With sparse data set to 1 the optimization results in a 2% increase in performance. Not mind blowing, but still. The same change applied to the producer thread loop (localizing the reference to the queue field) discussed in the previous post enabled a 10% difference in performance as the field reference stopped the loop from unrolling and was read on each iteration. I used the poll() example here because it involves allot less assembly code to wade through.

        Hopefully this illustrates the issue to Mr. Shipilev's content. Thanks goes to Gil Tene for pointing out the optimization to me and to Chris Newland for JITWatch.

        Unsafe Pointer Chasing: Running With Scissors

        $
        0
        0
        Love running? Love scissors? I know just the thing for you! Following on from recent discussion on the Mechanical Sympathy mailing list I see an anti pattern worth correcting in the way people use Unsafe. I say correcting as I doubt people are going to stop, so they might as well be made aware of the pitfalls. This pattern boils down to a classic concurrency bug:

        Q: "But... I not be doing no concurrency or nuffin' guv"
        A: Using Unsafe to gain a view of on-heap addresses is concurrent access by definition.

        Unsafe address: What is it good for?

        Absolutely nothing! sayitagain-huh! I exaggerate, if it was good for nothing it would not be there, let's look at the friggin manual:
        As we can see the behaviour is only defined if we use the methods together, and by that I mean that get/putAddress are only useful when used with an address that is within a block of memory allocated by allocateMemory. Now undefined is an important word here. It means it might work some of the time... or it might not... or it might crash your VM. Let's think about this.

        Q: What type of addresses are produced by allocateMemory?
        A: Off-Heap memory addresses -> unmanaged memory, not touched by GC or any other JVM processes

        The off-heap addresses are stable from the VM point of view. It has no intention of running around changing them, once allocated they are all yours to manage and if you cut your fingers in the process or not is completely in your control, this is why the behaviour is defined. On-Heap addresses on the other hand are a different story.

        Playing With Fire: Converting An Object Ref to An Address

        So imagine you just had to know the actual memory address of a given instance... perhaps you just can't resist a good dig under the hood, or maybe you are concerned about memory layout... Here's how you'd go about it:
        Now... you'll notice the object ref needs a bit of cuddling to turn into an address. Did I come up with such devilishly clever code myself? No... I will divulge a pro-tip here:
        If you are going to scratch around the underbelly of the JVM, learn from as close to the JVM as you can -> from the JDK classes, or failing that, from an OpenJDK project like JOL (another Shipilev production)
        In fact, the above code could be re-written to:
        Now that we have the address what can we do with it? Could we use it to copy the object? maybe we could read or modify the object state? NO! we can but admire it's numerical beauty and muse on the temperamental values waiting at the other end of that address. The value at the other end of this address may have already been moved by GC...

        Key Point: On-Heap Addresses Are NOT Stable

        Consider the fact that at any time your code may be paused and the whole heap can be moved around... any address value you had which pointed to the heap is now pointing to a location holding data which may be trashed/outdated/wrong and using that data will lead to a funky result indeed. Also consider that this applies to class metadata or any other internal accounting managed by the JVM.
        If you are keen to use Unsafe in the heap, use object references, not addresses. I would urge you not to mix the 2 together (i.e. have object references to off-heap memory) as that can easily lead to a very confused GC trying to chase references into the unknown and crashing your VM.

        Case Study: SizeOf an Object (Don't do this)

        This dazzling fit of hackery cropped up first (to my knowledge) here on the HighScalability blog:
        This is some sweet macheta swinging action :-). The dude who wrote this is not suggesting it is safe, and only claims it is correct on a 32bit VM. And indeed, it can work and passes cursory examination. The author also states correctly that this will not work for arrays and that with some corrections this can be made to work for 64 bit JVMs as well. I'm not going to try and fix it for 64 bit JVMs, though most of the work is already done in the JOL code above. The one flaw in this code that cannot be reliably fixed is that it relies on the native Klass address (line 6) to remain valid long enough for it to chase the pointer through to read the layout helper (line 8). Spot the similarity to the volatile bug above?
        This same post demonstrates how to forge references from on-heap objects to off-heap 'objects' which in effect let you cast a pointer to a native reference to an object. It goes on to state that is a BAD IDEA, and indeed it can easily crash your VM when GC comes a knocking (but it might not, I didn't try).

        Case Study: Shallow Off-Heap Object Copy (Don't do this)

        Consider the following method of making an off-heap copy of an object (from here, Mishadof's blog):
        We see the above is using the exact same method for computing size as demonstrated above. It's getting the on-heap object address (limited correctness, see addresses discussion above) than copying the object off-heap and reading it back as a new object copy... Calling the Unsafe.copyMemory(srcAddress, destAddress, length) is inviting the same concurrency bug discussed above. A similar method is demonstrated in the HighScalability post, but  there the copy method used is Unsafe.copyMemory(srcRef, srcOffset, destRef, destOffset, length). This is important as the reference using method is not exposed to the same concurrency issue.
        Both are playing with fire ofcourse by converting off-heap memory to objects. Imagine this scenario:
        • a copy of object A is made which refers to another object B, the copy is presented as object C
        • object A is de-referenced leading to A and B being collected in the next GC cycle
        • object C is still storing a stale reference to B which is no managed by the VM
        What will happen if we read that stale reference? I've seen the VM crash in similar cases, but it might just give you back some garbage values, or let you silently corrupt some other instance state... oh, the fun you will have chasing that bugger down...

        Apologies

        I don't mean to present either of the above post authors as fools, they are certainly clever and have presented interested findings for their readers to contemplate without pretending their readers should run along and build on their samples. I have personally commented on some of the code on Mishadof's post and admit my comments were incomplete in identifying the issues discussed above. If anything I aim to highlight that this hidden concurrency aspect can catch out even the clever.
        Finally, I would be a hypocrite if I told people not to use Unsafe, I end up using it myself for all sorts of things. But as Mr. Maker keeps telling us "Be careful, because scissors are sharp!"

        Where is my safepoint?

        $
        0
        0
        My new job (at Azul Systems) leads me to look at JIT compiler generated assembly quite a bit. I enjoy it despite, or perhaps because, the amount of time I spend scratching my increasingly balding cranium in search of meaning. On one of these exploratory rummages I found a nicely annotated line in the Zing (the Azul JVM) generated assembly:
        gs:cmp4i [0x40 tls._please_self_suspend],0jnz 0x500a0186
        Zing is such a lady of a JVM, always minding her Ps and Qs! But why is self suspending a good thing?

        Safepoints and Checkpoints

        There are a few posts out there on what is a safepoint (here's a nice one going into when it happens, and here is a long quote from Mechnical Sympthy mailing list on the topic). Here's the HotSpot glossary entry:
        safepoint
        A point during program execution at which all GC roots are known and all heap object contents are consistent. From a global point of view, all threads must block at a safepoint before the GC can run. (As a special case, threads running JNI code can continue to run, because they use only handles. During a safepoint they must block instead of loading the contents of the handle.) From a local point of view, a safepoint is a distinguished point in a block of code where the executing thread may block for the GC. Most call sites qualify as safepoints. There are strong invariants which hold true at every safepoint, which may be disregarded at non-safepoints. 
        To summarize, a safepoint is a known state of the JVM. Many operations the JVM needs to do happen only at safepoints. The OpenJDK safepoints are global, while Zing has a thread level safepoint called a checkpoint. The thing about them is that at a safepoint/checkpoint your code must volunteer to be suspended to allow the JVM to capitalize on this known state.
        What will happen while you get suspended varies. Objects may move in memory, classes may get unloaded, code will be optimized or deoptimized, biased locks will unbias.... or maybe your JVM will just chill for a bit and catch its breath. At some point you'll get your CPU back and get on with whatever you were doing.
        This will not happen often, but it can happen which is why the JVM makes sure you are never too far from a safepoint  and voluntary suspension. The above instruction from Zing's generated assembly of my code is simply that check. This is called safepoint polling.
        The safepoint polling mechanism for Zing is comparing a thread local flag with 0. The comparison is harmless as long as the checkpoint flag is 0, but if the flag is set to 1 it will trigger a checkpoint call (the JNZ following the CMP4i will take us there) for the particular thread. This is key to Zing's pause-less GC algorithm as application threads are allowed to operate independently.

        Reader Safpoint

        Having happily grokked all of the above I went looking for the OpenJDK safepoint.

        Oracle/OpenJDK Safepoints

        I was hoping for something equally polite in the assembly output from Oracle, but no such luck. Beautifully annotated though the Oracle assembly output is when it comes to your code, it maintains some opaqueness when it's internals are concerned. After some digging I found this:
        test   DWORD PTR [rip+0xa2b0966],eax        # 0x00007fd7f7327000
                                                        ;   {poll}
        No 'please', but still a safepoint poll. The OpenJDK mechanism for safepoint polling is by accessing a page that is protected when requiring suspension at a safepoint, and unprotected otherwise. Accessing a
        protected page will cause a SEGV (think exception) which the JVM will handle (nice explanation here). To quote from the excellent Alexey Ragozin blog:
        Safepoint status check itself is implemented in very cunning way. Normal memory variable check would require expensive memory barriers. Though, safepoint check is implemented as memory reads a barrier. Then safepoint is required, JVM unmaps page with that address provoking page fault on application thread (which is handled by JVM’s handler). This way, HotSpot maintains its JITed code CPU pipeline friendly, yet ensures correct memory semantic (page unmap is forcing memory barrier to processing cores).
        The [rip+0xa2b0966] addressing is a way to save on space when storing the page address in the assembly code. The address commented on the right is the actual page address, and is equal to the rip (Relative Instruction Pointer) + given constant. This saves space as the constant is much smaller than the full address representation. I thank Mr. Tene for clarifying that one up for me.
        If we were to look at safepoints throughout the assembly of the same process they would all follow the above pattern of pointing at the same global magic address (via this local relative trick). Setting the magic page to protected will trigger the SEGV for ALL threads. Note that the Time To Safe Point (TTSP) is not reported as GC time and may prove a hidden performance killer for your application. The effective cost of this global safepoint approach goes up the more runnable (and scheduled) threads your application has (all threads must wait for a safepoint consensus before the operation to be carried out at the safepoint can start).


        Find The Safpoint Summary

        In short, when looking for safepoints in Oracle/OpenJDK assembly search for poll. When looking at Zing assembly search for _please_self_suspend.


        Java Object Layout: A Tale Of Confusion

        $
        0
        0
        Buy the T-shirt
        Following the twists and turns of the conversation on this thread in the Mechanical Sympathy mailing list highlights how hard it is to reason about object layout based on remembered rules. Mostly every person on the thread is right, but not completely right. Here's how it went...

        Context

        The thread discusses False Sharing as described here. It is pointed out that the padding is one sided and padding using inheritance is demonstrated as solution. The merits of using inheritance vs. using an array and utilizing Unsafe to access middle element (see Disruptor's Sequence) vs. using AtomicLongArray to achieve the same effect are discussed (I think the inheritance option is best, as explored here). And then confusion erupts...

        What's my layout?

        At this point Peter L. makes the following point:
        [...]in fact the best option may be.
        class Client1 {
            private long value;
            public long[] padding = new long[5];
        }
        What follows is a series of suggestions on what the layout of this class may be.

        Option 1: My recollections

        I was too lazy to check and from memory penned the following:
        [...] the ordering of the fields may end up shifting the reference (if it's 32bit or CompressedOop) next to the header to fill the pad required for the value field. The end layout may well be:
        12b header
        4b padding(oop)
        8b value

        Option 2: Simon's recollections

        Simon B. replied:
        [...] I thought Hotspot was laying out longs before
        references, and that the object header was 8 Bytes.
        So I would expect Client1 to be laid out in this way:
        8B header
        8B value
        4B padding (oop)
        [...] Am I out of date in object layout and header size ?

        Option 3: TM Jee's doubts

        Mr. Jee slightly changed the class and continued:
        for:
        class Client1 {
            private long value;
            public long[] padding = new long[5]
            public Object[] o = new Object[1];
        }
        the memory layout should be something like
        12b header (or is it 16b)
        8b value
        4b for the long[] (its just the reference which is 4b for compressed and 8b if not)
        4b for the Object[] (again it's just the reference)
        Is this right so far?
        To which  Peter L. wisely replied:
        Yes. But as you recognise the sizes of the header and sizes of references are not known until runtime.

        Option 4: Check...

        So I used JOL to check. And as it turns out we are all somewhat right and somewhat wrong...
        I'm right for compressed oops (the default for 64bit):
        Running 64-bit HotSpot VM.
        Using compressed references with 3-bit shift.
        Client1 object internals:
         OFFSET  SIZE     TYPE DESCRIPTION
              0     4          (object header)
              4     4          (object header)
              8     4          (object header)
             12     4   long[] Client1.padding
             16     8     long Client1.value
             24     4 Object[] Client1.o
             28     4          (loss due to the next object alignment)

        The header is 12b and the array reference is shifted up to save on space. But my casual assumption 32bit JVM layout will be the same is wrong.

        Simon is right that the header is 8b (but only for 32bit JVMs) and that references will go at the end (for both 32bit and 64bit, but not with compressed oops):
        Running 32-bit HotSpot VM.
        Client1 object internals:
         OFFSET  SIZE     TYPE DESCRIPTION
              0     4          (object header)
              4     4          (object header)
              8     8     long Client1.value
             16     4   long[] Client1.padding
             20     4 Object[] Client1.o

        And finally with 64bit Mr. Jee is right too:
        Running 64-bit HotSpot VM.
        Client1 object internals:
         OFFSET  SIZE     TYPE DESCRIPTION
              0     4          (object header)
              4     4          (object header)
              8     4          (object header)
             12     4          (object header)
             16     8     long Client1.value
             24     8   long[] Client1.padding
             32     8 Object[] Client1.o

        And Peter is entirely right to point out the runtime is the crucial variable in this equation.

        Lesson?

        If you catch yourself wondering about object layout:
        1. Use JOL to check, it's better than memorizing rules
        2. Remember that 32/64/64+Oops are different for Hotspot, and other JVMs may have different layouts altogether
        3. Read another post about java memory layout


          Notes On Concurrent Ring Buffer Queue Mechanics

          $
          0
          0
          Having recently implemented an MPMC queue for JAQ (my concurrent queue collection) I have been bitten several times by the quirks of the underlying data structure and it's behaviour. This is an attempt at capturing some of the lessons learnt. I call these aspects or observations 'mechanics' because that's how they feel to me (you could call them Betty). So here goes...

          What is a Ring Buffer?

          A ring buffer is sometimes called a circular array or circular buffer (here's wiki) and is a pre-allocated finite chunk of memory that is accessed in a circular fashion to give the illusion of an infinite one. The N+1 element of a ring buffer of size N is the first element again:

          So the first mechanical aspect to observe here is how the circularity is achieved. I'm using a modulo operator above, but you could use a bitwise AND instead if queue size was a power of 2 (i%(2^k) == i&((2^k) -1)). Importantly, circularity implies 2 different indexes can mean the same element.
          Trivial stuff, I know, moving right along.

          A Ring Buffer Based Bounded Queue: Wrap and Bounds

          Ring buffers are used to implement all sorts of things, but in this particular case let us consider a bounded queue. In a bounded queue we are using the underlying buffer to achieve re-use, but we no longer pretend the capacity is infinite. We need to detect the queue being full/empty and track the next index to be offered/polled. For the non-thread safe case we can meet these requirements thus:

          As an alternative we can use the data in the queue to detect the full/empty states:

          The next mechanical aspect we can notice above is that for a queue to work we need to stop the producer from wrapping around and overwriting unread elements. Similarly we need the consumer to observe the queue is empty and stop consuming. The consumer is logically 'chasing' the producer, but due to the circular nature of the data structure the producer is also chasing the consumer. When they catch up to each other we hit the full/empty state.

          The Single Producer/Consumer case: Visibility and Continuity

          In the  SPSC (single producer/consumer threads, no more) case life remains remarkably similar to the non-thread safe case. Sure we can optimize memory layout and so on, but inherently the code above works with very minor changes. You will notice in the following code that I'm using a lovely hungarian notation of my own design, lets get the full notation out of the way:
          • lv - load volatile (LoadLoad barrier)
          • lp - load plain
          • sv - store volatile (LoadStore barrier)
          • so - store ordered (StoreStore barrier), like lazySet
          • sp - store plain
          • cas - compare and swap
          lv/so for the counters could be implemented using an AtomicLong, an AtomicFieldUpdater or Unsafe. Here goes:
            And the alternative (lvElement/soElement could be implemented using Unsafe or by replacing the original buffer with an AtomicReferenceArray):

            All we needed to add are appropriate memory barriers to enforce visibility and ordering. The mechanical observation to be made regarding the barriers is that correct publication is a product of ordered visibility. This is very prominent in the counter based approach where the counter visibility derives data visibility in the queue. The second approach is slightly more subtle but the ordered write and volatile read guarantee correct publication of the element contents. This is an important property of concurrent queues that elements are not made visible to other threads before preceding writes to their contents.
            I've added an optimization on the alternative offer that highlights a mechanical property of the SPSC and non-thread safe cases. The offer is probing ahead on the buffer, if the "tail + look ahead constant" element is null we can deduce that all the elements up to it are also null and write without checking them. This property of the queue is the continuity of data existence. We expect the ring buffer to be split to an all empty section and an all full section and we expect no 'holes' in either.

            The MPSC case: Atomicity and Holes in the fabric of Existence

            So now we have multiple threads hitting the queue. We need to ensure the blighters don't over-write the same slot and so we must increment head atomically before writing to the queue:

            An interesting thing happens on the consumer side here. We can no longer rely on the tail counter for data visibility because the increment is done before the data is written. We must wait for the data to become visible and can't just assume it is there as we did before. This highlights the fact that tail is no longer indicative of producer progress.
            The alternative poll method in this case cuts straight to the issue:

            I will not show the code for the SPMC case, it is very similar, but one point is worth examining. For the SPMC the offer method can no longer employ the probe ahead optimization shown above. That is because the continuity property is no longer true (a real shame, I liked it allot). Consider 2 consumer threads where one has progressed the danger point where head will be visible but not the data, and the other charging ahead of it. The slot is not null and remains so until the thread resumes. This means the empty section of the queue now has a hole (not null element) in it... making the probe ahead optimization void. If we were to keep the optimization the producer would assume the coast is clear and may overwrite an element in the queue before it is consumed.
            For both MPSC/SPMC and also MPMC we can therefore observe that counter increment atomicity does not imply queue write atomicity. We can also see that this scheme has no fairness of counter acquisition or slot use so it is possible to have many producers/consumers stuck while others make progress. For example, given 3 producers A, B and C we can have the queue fill up such that the slots are claimed to the effect of: [ABBBBBBBCAAAAACCCABABACCCC...] or any such random layout based on the whims of the scheduler and CAS contention.

            The MPMC case: What Goes Around

            So finally all hell breaks loose and you have multiple producers and consumers all going ape pulling and pushing. What can we do? I ended up going with the solution put forward by Mr. D. Vyukov after I implemented a few flawed variations myself (an amusing story to be told some other time). His solution is in C and benefits from the memory layout afforded by languages with struct support. I had to mutate the algorithm (any bugs are my own) to use 2 arrays instead of one struct array but otherwise the algorithm is the very similar:

            So... what just happened?
            • We're setting up each slot with a sequence
            • A producer can only write to the slot if the sequence matches tail and they won the CAS
            • A consumer can only read the slot if the sequence is head + 1 and they won the CAS
            • Once a producer writes a slot he sets it's sequence to tail + 1
            • Once a consumer reads a slot she sets the sequence to head + buffer.length
            Why can't we rely on the head/tail anymore? well... the head/tail values were half useless before as pointed out in the MPSC section because they reflect the most advance consumer/producer and cannot indicate data state in the queue.
            Can't we use the null/not-null check like before? mmm... this one is a bugger. The surprising problem here is producers catching up with other producers after wrapping and consumers doing the same to other consumers. Imagine a short queue, 2 slots only, and 2 producer threads. Thread one wins the CAS and stalls before writing slot 1, thread 2 fills second slot and comes round to hit slot 1 again, wins the CAS and either writes over thread 1 or gets written over by thread 1. They can both see the slot as empty when they get there.
            A solution relying on counters exists such that it employs a second CAS on the data, but:

            1. It is slower, which is to be expected when you use 2 CAS instead of one
            2. It runs the risk of threads getting stuck to be freed only when the other threads come full circle again. Think of a producer hitting another producer on the wrap as discussed before and then one wins the CAS on data and the other is left to spin until the slot is null again. This should be extremely rare (very hard to produce in testing, possible by debugging to the right points), but is not a risk I am comfortable with.

            I'm hoping to give concrete examples broken code in a further post, but for now you can imagine or dig through the commit history of JAQ for some examples.
            The sequence array is doubling our memory requirement (tripling it for 32bit/compressed oops). We might be able to get by with an int array instead. The solution works great in terms of performance, but that is another story (expect followup post).
            The important observation here on the mechanical side is that for MPMC both head and tail values are no longer reliable means of detecting wrap and as such we have to detect wrap by means other than head/tail counters and data existence.

            Summary

            • Circular/ring array/buffer give the illusion of infinite arrays but are actually finite.
            • Bounded queues built on ring buffers must detect queue full/empty states and track head/tail positions.
            • Ring buffers exhibit continuity of existence for the full/empty sections ONLY in the SPSC or single threaded case.
            • MPSC/SPMC/MPMC queues lose continuity, can have holes.
            • Counter increment atomicity does not imply write atomicity.
            • MP means tail is no longer a reliable means of ensuring next poll is possible.
            • MC means head is no longer a reliable mean of ensuring next offer is possible.
            • MPMC implementations must contend with producer/producer and consumer/consumer collisions on wrap.
            I'm publishing this post in a bit of a rush, so please comment on any inaccuracies/issues/uncertainties and I shall do my best to patch/explain if needed. Many thanks go out to Martin Thompson, Georges Gomez, Peter Hughes and anybody else who's bored of hearing my rambles on concurrent queues.

            Advice for the concurrently confused: AtomicLong JDK7/8 vs. LongAdder

            $
            0
            0
            Almost a year ago I posted some thoughts on scalable performance counters and compared AtomicLong, a LongAdder backport to JDK7, Cliff Clicks ConcurrentAtomicTable and my own humble ThreadLocalCounter. With JDK8 now released I thought I'd take an opportunity to refresh the numbers and have a look at the delivered LongAdder and the now changed AtomicLong. This is also an opportunity to refresh the JMH usage for this little exercise.

            JMH Refresh

            If you never heard of JMH here are a few links to catch up on:
            In short, JMH is a micro-benchmarking harness written by the Oracle performance engineering team to help in constructing performance experiments while side stepping (or providing means to side step) the many pitfalls of Java related benchmarks.

            Experiment Refresh

            Here's a brief overview of the steps I took to update the original benchmark to the current:
            • At the time I wrote the original post JMH was pretty new but already had support for thread groups. Alas there was no way to tweak their size from the command line. Now there is so I could drop the boilerplate for different thread counts.
            • Hide counter types behind an interface/factory and use single benchmark (was possible before, just tidying up my own mess there).
            • Switched to using @Param to select the benchmarked counter type. With JMH 0.9 the framework will pick up an enum and run through it's values for me, yay!

            The revised benchmark is pretty concise:
            The JMH infrastructure takes care of launching requested numbers of incrementing/getting threads and sums up all the results neatly for us. The @Param defaults will run all variant if we don't pick a particular implementation from the command line. All together a more pleasant experience than the rough and tumble of version 0.1. Code repository is here.

            AtomicLong: CAS vs LOCK XADD

            With JDK8 a change has been made to the AtomicLong class to replace the CAS loop:
            With a single intrinsic:
            getAndAddLong() (which corresponds to fetch-and-add) translates into LOCK XADD on x86 CPUs which atomically returns the current value and increments it. This translates into better performance under contention as we leave the hardware to negotiate the atomic increment.

            Incrementing only

            Running the benchmark with incrementing threads only on a nice (but slightly old) dual socket Xeon X5650@2.67GHz (HyperThreading is off, 2 CPUs, 6 cores each, JDK7u51, JDK8u5) shows the improvement:

            • Left hand column is number of threads, all threads increment
            • All numbers are in nanoseconds measuring the average cost per op
            • Values are averaged across threads, so the cost per op is presented from a single threaded method call perspective.


            JDK7-AL.inc(err)JDK8-AL.inc(err)
            19.8+/-0.06.2+/-0.0
            240.4+/-2.134.7+/-0.8
            369.4+/-0.354.1+/-5.6
            490.2+/-2.885.4+/-1.3
            5123.3+/-3.7102.7+/-1.9
            6144.2+/-0.4120.4+/-2.5
            7398.0+/-29.6276.6+/-33.9
            8417.3+/-32.6307.8+/-39.1
            9493.8+/-46.0257.5+/-16.4
            10457.7+/-17.9409.8+/-34.8
            11515.3+/-13.7308.5+/-10.1
            12537.9+/-7.9351.3+/-7.6

            Notes on the how benchmarks were run:
            • I used taskset to pin the benchmark process to a set of cores
            • The number of cores allocated matches the number of threads required by the benchmark
            • Each socket has 6 cores and I taskset the cores from a single socket from 1 to 6, then spilt over to utilizing the other socket. In the particular layout of cores on this machine this turned out to translate into taskset -c 0-<number-of-threads - 1>
            • There are no get() threads in use, only inc() threads. This is controlled from the command line by setting the -tg option. E.g. -tg 0,6 will spin no get() threads and 6 inc() threads
             Observations:
            • JDK 8 AtomicLong is consistently faster as expected.
            • LOCK XADD does NOT cure the scalability issue in this case. This echoes the rule of thumb by D. Yukov here, which is that shared data writes are a scalability bottleneck (he is comparing private writes to a LOCK XADD on shared). The chart in his post demonstrates throughput rather than cost per op and the benchmark he uses is somewhat different. Importantly his chart demonstrates LOCK XADD hits a sustained throughput which remains fixed as threads are added. The large noise in the dual socket measurements renders the data less than conclusive in my measurements here but the throughput does converge. 
            • When we cross the socket boundary (>6 threads) the ratio between JDK7 and JDK8 increases.
            • Crossing the socket boundary also increases results variability (as expressed by the error). 
            This benchmark demonstrates cost under contention. In a real application with many threads doing a variety of tasks you are unlikely to experience this kind of contention, but when you hit it you will pay.

            LongAdder JDK7 backport vs. JDK8 LongAdder

            Is a very boring comparison as they turn out to scale and cost pretty much the same (minor win for the native LongAdder implementation). It is perhaps comforting to anyone who needs to support a JDK7 client base that the backport should work fine on both and that no further work is required for now. Below are the results, LA7 is the LongAdder backport, LA8 is the JDK8 implementation:


            JDK7-LA7.inc(err)JDK8-LA7.inc(err)JDK8-LA8.inc(err)
            19.8+/-0.010.0+/-0.89.8+/-0.0
            212.1+/-0.610.8+/-0.110.0+/-0.1
            311.5+/-0.411.7+/-0.310.3+/-0.0
            412.4+/-0.611.1+/-0.110.3+/-0.0
            512.4+/-0.811.5+/-0.610.3+/-0.0
            611.8+/-0.311.1+/-0.310.3+/-0.0
            711.6+/-0.412.9+/-1.310.6+/-0.4
            811.8+/-0.611.8+/-0.710.8+/-0.5
            912.9+/-0.912.0+/-0.710.5+/-0.3
            1012.6+/-0.412.1+/-0.611.0+/-0.5
            1111.5+/-0.212.3+/-0.610.7+/-0.3
            1211.7+/-0.411.5+/-0.310.4+/-0.1

            JDK8: AtomicLong vs LongAdder

            Similar results were demonstrated has been discussed in the prev. post, but here's the JDK8 versions side by side:


            JDK8-AL.inc(err)JDK8-LA8.inc(err)
            16.2+/-0.09.8+/-0.0
            234.7+/-0.810.0+/-0.1
            354.1+/-5.610.3+/-0.0
            485.4+/-1.310.3+/-0.0
            5102.7+/-1.910.3+/-0.0
            6120.4+/-2.510.3+/-0.0
            7276.6+/-33.910.6+/-0.4
            8307.8+/-39.110.8+/-0.5
            9257.5+/-16.410.5+/-0.3
            10409.8+/-34.811.0+/-0.5
            11308.5+/-10.110.7+/-0.3
            12351.3+/-7.610.4+/-0.1

            Should I use AtomicLong or LongAdder?

            Firstly this question is only relevant if you are not using AtomicLong as a unique sequence generator. LongAdder does not claim to, nor makes any attempt to give you that guarantee. So LongAdder is definitely NOT a drop in replacement for AtomicLong, they have very different semantics.
            From the LongAdder JavaDoc:
            This class is usually preferable to AtomicLong when multiple threads update a common sum that is used for purposes such as collecting statistics, not for fine-grained synchronization
            control.  Under low update contention, the two classes have similar characteristics. But under high contention, expected throughput of this class is significantly higher, at the expense of higher space consumption.
            Assuming you were using AtomicLong as a counter you will need to consider a few tradeoffs:
            • When NO contention is present, AtomicLong performs slightly better than LongAdder.
            • To avoid contention LongAdder will allocate Cells (see previous post for implementation discussion) each Cell will consume at least 256 bytes (current implementation of @Contended) and you may have as many Cells as CPUs. If you are on a tight memory budget and have allot of counters this is perhaps not the tool for the job.
            • If you prefer get() performance to inc() performance than you should definitely stick with AtomicLong.
            • When you prefer inc() performance and expect contention, and when you have some memory to spare then LongAdder is indeed a great choice.

            Bonus material: How the Observer effects the Experiment

            What is the impact of reading a value that is being rapidly mutated by another thread? On the observing thread side we expect to pay a read-miss, but as discussed prev. here there is a price to pay on the mutator side as well. I run the same benchmark with an equal number of inc()/get() threads. The process is pinned as before but as the roles are not uniform I have no control on which socket the readers/writers end up on, so we should expect more noise as we cross the socket line (LA - LongAdder, AL - AtomicLong, both on JDK8, same type ing/get are within the same run, left column is number of inc()/get() threads):


            LA.get(err)LA.inc(err)AL.get(err)AL.inc(err)
            1,14.7+/-0.268.6+/-5.010.2+/-1.039.1+/-7.6
            2,224.9+/-2.769.7+/-4.041.5+/-26.487.6+/-11.0
            3,3139.9+/-24.369.0+/-8.255.1+/-13.3157.4+/-28.2
            4,4332.9+/-10.380.4+/-5.156.8+/-7.6198.7+/-21.1
            5,5479.3+/-13.284.1+/-4.471.9+/-7.3233.1+/-20.1
            6,6600.6+/-11.289.8+/-4.6152.1+/-41.7343.2+/-41.0

            Now that is a very different picture... 2 factors come into play:
            1. The reads disturb the writes by generating cache coherency noise as discussed here. A writer must have the cache line in an Exclusive/Mutated state, but the read will cause it to shift into Shared.
            2. The get() measurement does not differentiate between new values and old values.
            This second point is important as we compare different means of mutating values being read. If the value being read is slowly mutating we will succeed in reading the same value many times before a change is visible. This will make our average operation time look great as most reads will be L1 hitting. If we have a fast incrementing implementation we will cause more cache misses for the reader making it look bad. On the other hand a slow reader will cause less of a disturbance to the incrementing threads as it produces less coherency noise, thus making less of a dent in the writer performance. Martin Thompson has previously hit on this issue from a different angle here (Note his posts discuss Nahelem and Sandybridge, I'm benchmarking on Westmere here).
            In this light I'm not sure we can read much into the effect of readers in this particular use case. The 'model' represented by a hot reading thread does not sit well with the use case I have in mind for these counters which is normally as performance indicators to be sampled at some set frequency (once a second or millisecond). A different experiment is more appropriate, perhaps utilising Blackhole.consumeCPU to set a gap between get() (see a great insight into this method here).
            With this explanation in mind we can see perhaps more sense in the following comparison between AtomicLong on JDK7 and JDK8:


            AL7.get(err)AL7.inc(err)AL8.get(err)AL8.inc(err)
            1,14.0+/-0.261.1+/-7.810.2+/-1.039.1+/-7.6
            2,27.0+/-0.3133.1+/-2.941.5+/-26.487.6+/-11.0
            3,321.8+/-3.4278.5+/-47.455.1+/-13.3157.4+/-28.2
            4,427.2+/-3.3324.1+/-34.656.8+/-7.6198.7+/-21.1
            5,531.2+/-1.8378.5+/-28.171.9+/-7.3233.1+/-20.1
            6,657.3+/-12.5481.8+/-39.4152.1+/-41.7343.2+/-41.0

            Now consider that the implementation of get() has not changed. The reason for the change in cost for get is down to the increase in visible values and thus cache misses caused by the change to the increment method.

              Notes on False Sharing

              $
              0
              0
              I've recently given a talk on queues and related optimisations, but due to the limitations of time, the Universe and Everything else had to cut short the deep dive into false sharing. Here however I'm not limited by such worldly concerns, so here is more detail for those who can stomach it.

              What mean False Sharing?

              Described before on this blog and in many other places (IntelusenixMr. T), but assuming you are not already familiar with the issue:
              "false sharing is a performance-degrading usage pattern that can arise in systems with distributed, coherent caches at the size of the smallest resource block managed by the caching mechanism. When a system participant attempts to periodically access data that will never be altered by another party, but that data shares a cache block with data that is altered, the caching protocol may force the first participant to reload the whole unit despite a lack of logical necessity. The caching system is unaware of activity within this block and forces the first participant to bear the caching system overhead required by true shared access of a resource." - From Wikipedia
              Makes sense, right?
              I tried my hand previously at explaining the phenomena in terms of the underlying coherency protocol which boils down to the same issue. These explanations often leave people still confused and I spent some time trying to reduce the explanation so that the idea can get across in a presentation... I'm pretty sure it still left people confused.
              Let's try again.
              The simplest explanation I've come up with to date is:
              1. Memory is cached at a granularity of a cache line (assumed 64 bytes, which is typical, in the following examples but may be a smaller or larger power of 2, determined by the hardware you run on)
              2. Both reading and writing to a memory location from a particular CPU require the presence of a copy of the memory location in the reading/writing CPU cache. The required location is 'viewed' or cached at the granularity of a cache line.
              3. When a line is not in a threads cache we experience a cache miss as we go searching for a valid copy of it.
              4. Once a line is in our cache it may get evicted (when more memory is required) or invalidated (because a value in that line was changed by another CPU). Otherwise it just stays there.
              5. A write to a cache line invalidates ALL cached copies of that line for ALL CPUs except the writer.
              I think there is a mistaken intuition most of us have when it comes to memory access, which is that we think of it as direct. In reality however you access memory through the CPU cache hierarchy and it is in the attempt to make this system coherent and performant that the hardware undoes our intuition. Rather than thinking of all CPUs accessing a global memory pool we should have a mental model that is closer to a distributed version control system as illustrated in this excellent post on memory barriers.
              Given the above setting of the stage we can say that false sharing occurs when Thread 1 invalidates (i.e writes to) a cache line required by Thread2 (for reading/writing) even though Thread2 and Thread1 are not accessing the same location.
              The cost of false sharing is therefore observable as cache misses, and the cause of false sharing is the write to the cache line (coupled with the granularity of cache coherency). Ergo, the symptom of false sharing can be observed by looking at hardware events for your process or thread:
              • If you are on linux you can use perf. (Checkout the awesome perf integration in JMH!)
              • On linux/windows/mac Intel machines there is PCM.
              • From Java you can use Overseer
              • ... look for hardware counters on google.
              Now assuming you have established that the number of cache misses you experience is excessive, the challenge remains in finding the sources of these cache misses. Sadly for Java there is no free utility that I'm aware of which can easily point you to the source of your false sharing problem, C/C++ developers are spoilt for choice by comparison. Some usual suspects to consider however are any shared data constructs, for example queues.


              Active False Sharing: Busy Counters

              Lets start with a queue with 2 fields which share the same cache line where each field is being updated by a separate thread. In this example we have an SPSC queue with the following structure:
              Ignoring the actual correct implementation and edge cases to make this a working queue (you can read more about how that part works here), we can see that offer will be called by one thread, and poll by another as this is an SPSC queue for delivering messages between 2 threads. Each thread will update a distinct field, but as the fields are all jammed tight together we know False Sharing is bound to follow.
              The solution at the time of writing seems to be the introduction of padding by means of class inheritance which is covered in detail here. This will add up to an unattractive class as follows:
              Yipppeee! the counters are no longer false sharing! That little Pad in the middle will make them feel all fresh and secure.


              Passive False Sharing: Hot Neighbours

              But the journey is far from over (stay strong), because in False Sharing you don't have to write to a shared cache line to suffer. In the above example both the producer and the consumer are reading the reference to buffer which is sharing a cache line with naughty Mr. consumerIndex. Every time we update consumerIndex an angel loses her wings! As if the wings business wasn't enough, the write also invalidates the cache line for the producer which is trying to read the buffer so that it can write to the damn thing. The solution?
              MORE PADDING!!
              Surely now everyone will just get along?

              The Object Next Door

              So now we have the consumer and the producer feverishly updating their respective indexes and we know the indexes are not interfering with each other or with buffer, but what about the objects allocated before/after our queue object? Imagine we allocate 2 instances of the queue above and they end up next to each other in memory, we'd be practically back to where we started with the consumerIndex on the tail end of one object false sharing with the producer index at the head end of the other. In fact, the conclusion we are approaching here is that rapidly mutated fields make very poor neighbours altogether, be it to other fields in the same class or to neighbouring classes. The solution?
              EVEN MORE PADDING!!! 
              Seems a tad extreme don't it? But hell, at least now we're safe, right?

              Buffers are people too

              So we have our queue padded like a new born on it's first trip out the house in winter, but what about Miss buffer? Arrays in Java are objects and as such the buffer field merely point to another object and is not inlined into the queue (as it can be in C/C++ for instance). This means the buffer is also subject to potentially causing or suffering from false sharing. This is particularly true for the length field on the array which will get invalidated by writes into the first few elements of the queue, but equally true for any object allocated before or after the array. For circular array queues we know the producer will go around writing to all the elements and come back to the beginning, so the middle elements will be naturally padded. If the array is small enough and the message passing rate is high enough this can have the same effect as any hot field. Alternatively we might experience an uneven behaviour for the queue as the elements around the edges of the array suffer false sharing while the middle ones don't.
              Since we cannot extend the array object and pad it to our needs we can over-allocate the buffer and never use the initial/last slots:
              We cannot prevent false sharing between neighbours and the array length, what we can do is hoist it into our own class field and use our copy instead of the buffer field. This can also result in better locality if the hoisted length value is hosted in a field alongside the array itself.
              Note that this is costing us some computational overhead to compute the offset index instead of the natural one, but in practice we can implement queues such that the we achieve the same effect with no overhead at all.

              Protection against the Elements

              While on this topic (I do go on about it... hmmm) we can observe that the producer and the consumer threads can still experience false sharing on the cache line holding adjacent elements in the buffer array. This is something we can perhaps handle more effectively if we had arrays of structs in Java (see the value types JEP and structured arrays proposal), and if the queue was to be a queue of such structs. Reality being the terrible place that it is, this is not the case yet. If we could prove our application indeed suffered from this issue, could we solve it?
              Yes, but at a questionable price...
              If we allocate extra elements for each reference we mean to store in the queue we can use empty elements to pad the used elements. This will reduce the density of each cache line and as a result the probability of false sharing as less and less elements are in a cache line. This comes a high cost however as we multiply the size of the buffer to make room for the empty slots and actively sabotage the memory throughput as we have less data per read cache line. This is an optimization I am reluctant to straight out recommend as a result, but what the hell? sometimes it might helps.

              Playing with Dirty Cards

              This last one is a nugget and a half. Usually when people say: "It's a JVM/compiler/OS issue" it turns out that it's a code issue written by those same people. But sometimes it is indeed the machine.
              In certain cases you might not be the cause of False Sharing. In some cases you might be experiencing False Sharing induced by card marking. I won't spoil it for you, follow the link.

              Summary

              So there you have it, 6 different cases of False Sharing encountered in the process of optimizing/proofing the piddly SPSC queue. Each one had an impact, some more easily measured than others. The take away here is not "Pad every object and field to death" as that will be detrimental in most cases, much like making every field volatile. But this is an issue worth keeping in mind when writing shared data structures, and in particular when considering highly contended ones.
              We've discussed 2 types of False Sharing:

              • Active: where both threads update distinct locations on the same cache line. This will severely impact both threads as they both experience cache misses and cause repeated invalidation of the cache line.
              • Passive: where one thread writes to and another reads from distinct locations on the same cache line. This will have a major impact on the reading thread with many reads resulting in a cache miss. This will also have an impact on the writer as the cache line sharing overhead is experienced.
              These were identified and mitigated in several forms:

              1. Neighbouring hot/hot fields (Active)
              2. Neighbouring hot/cold fields (Passive)
              3. Neighbouring objects (potential for both Active and Passive)
              4. Objects neighbouring an array and the array elements (same as 3, but worth highlighting as a subtlety that arrays are separate objects)
              5. Array elements and array length field (Passive as the length is never mutated)
              6. Distinct elements sharing the same cache line (Passive in above example, but normally Active as consumer nulls out the reference on poll)
              7. -XX:+UseCondCardMark - see Dave Dice article

              What should you do?
              1. Consider fields concurrently accessed by different threads, in particular frequently written to fields and their neighbours.
              2. Consider Active AND Passive false sharing.
              3. Consider (and be considerate to) your neighbours.
              4. All padding comes at the cost of using up valuable cache space for isolation. If over used (like in the elements padding) performance can suffer.
              And finally: love thy neighbour, just a little bit and with adequate protection and appropriate padding, but still love'em.
              Belgium! Belgium! Belgium! Belgium! Belgium! Belgium! Belgium! Belgium! Belgium! Belgium! Belgium!

              Concurrent Bugs: Size Matters

              $
              0
              0
              As part of my ongoing work on JCTools (no relation to that awfully popular Mexican dude) I've implemented SPSC/MPSC/MPSC/MPMC lock free queues, all of which conform to the java.util.Queue interface. The circular array/ring buffered variants all shared a similar data structure where a consumer thread (calling the poll() method) writes to the consumerIndex and a producer thread (calling the offer() method) writes to the producerIndex. They merrily chase each other around the array as discussed in this previous post.
              Recently I've had the pleasure of having Martin Thompson pore over the code and contribute some bits and pieces. Righteous brother that Mr. T is, he caught this innocent looking nugget (we're playing spot the bug, can you see it?):
              What could possibly go wrong?


              Like bugs? you'll looove Concurrency!

              The code above can return a negative number as the size. How can that be you wonder? Let us see the same method with some slow motion comments:

              See it?
              • We need not get suspended for this to happen. The independent loads could have the second one hit a cache miss and get delayed, or maybe the consumer and the producer are just moving furiously fast. The important thing to realise is that the loads are independent and so while there may not be much time between the 2, there is the potential for some time by definition.
              • Because the 2 loads are volatile they cannot get re-ordered.
              • Doing it all on one line, or on 3 different lines (in the same order) makes no difference at all.

              So how do we solve this?

              Is it really solved?
              • This will at least return a value that is in the correct range.
              • This will NOT ALWAYS return the right or correct number. The only way to get the absolutely correct number would be to somehow read both indexes atomically.
              • Atomically reading 2 disjoint longs is not possible... You can (on recent x86) atomically read 2 adjacent longs, but that is:
                • Not possible in Java
                • A recipe for false sharing
              • We could block the producers/consumers from making progress while we read the 2 values, but that would kill lock freedom.
              • This method is lock free, not wait free. In theory the while loop can spin forever in the same way that a CAS loop can spin forever. That is very unlikely however.
              This is as good as it gets baby.

              Lesson?

              We all know that a thread can get suspended and threads execution can interleave, but it is easy to forget/overlook that when looking at a line of code. This issue is in a way just as naive as incrementing a volatile field and expecting atomicity.
              Sometimes there is no atomicity to be found and we just have to come to terms with the best approximation to a good answer we can get...
              A further lesson here is that having your code reviewed by others is an amazingly effective way to find bugs, and learn :-)


              A Java Ping Buffet

              $
              0
              0
              Buffet pings
              When considering latency/response time in the context of client/server interactions I find it useful to measure the baseline, or no-op, round trip between them. This give me a real starting point to appreciate the latency 'budget' available to me. This blog post presents an open source project offering several flavours of this baseline measurement for server connectivity latency.

              How did it come about?

              I put the first variation together a while back to help review baseline assumptions on TCP response time for Java applications. I figured it would be helpful to have a baseline latency number of the network/implementation stack up to the application and back. This number may seem meaningless to some, as the application does nothing much, but it serves as a boundary, a ballpark figure. If you ever did a course about networking and the layers between your application and the actual wire (the network stack), you can appreciate this measurement covers a round trip from the application layer and back.
              This utility turned out to be quite useful (both to myself and a few colleagues) in the past few months. I tinkered with it some more, added another flavour of ping, and another. And there you have it, a whole bloody buffet of them. The project now implements the same baseline measurement for:
              • TCP
                • Busy spin on non-blocking sockets
                • Selector busy spin on selectNow
                • Selector blocking on select
                • Blocking sockets
                • Old IO sockets are not covered(maybe later)
              • UDP
                • Busy spin on non-blocking sockets
                • All the other cases covered for TCP are not covered(maybe later)
              • IPC via memory mapped file
              This code is not entirely uniform and I beg your forgiveness (and welcome you criticism) if it offends your sensibilities. The aim was for simplicity and little enough code that it needs little in the way of explaining. All it does is ping, and measure. All measurements are in nanoseconds (Thanks Ruslan for pointing out the omission).
              The original TCP spinning client/server code was taken from one of Peter Lawrey's examples, but it has been mutilated plenty since, so it's not really his fault if you don't like it. I also had great feedback and even some code contribution from Darach Ennis. Many thanks to both.
              My mother has a wicked back hand

              Taking the code for a drive

              Imagine that you got some kit you want to measure Java baseline network performance on. The reality of these things is that the performance is going to vary for JVM/OS/Hardware and tuning for any and all of the ingredients. So off you go building a java-ping.zip (ant dist), you copy it onto your server/servers of choice and unzip (unzip java-ping.zip -d moose). You'll find the zip is fairly barebones and contains some scripts and a jar. You'll need to make the scripts runnable (chmod a+x *.sh). Now assuming you have Java installed you can start the server:
              $ ./tcp-server.sh spin &
              And then the client:
              $ ./tcp-client.sh spin 

              And in lovely CSV format the stats will pour into your terminal, making you look busy.
              Min,50%,90%,99%,99.9%,99.99%,Max
              6210,6788,9937,20080,23499,2189710,46046305
              6259,6803,7464,8571,10662,17259,85020
              6275,6825,7445,8520,10381,16981,36716
              6274,6785,7378,8539,10396,16322,19694
              6209,6752,7336,8458,10381,16966,55930
              6272,6765,7309,8521,10391,15288,6156039
              6216,6775,7382,8520,10385,15466,108835
              6260,6756,7266,8508,10456,17953,63773
              Using the above as a metric you can fiddle with any and all the variables available to you and compare before/after/this/that configuration.
              In the previous post on this utility I covered the variance you can observe for taskset versus roaming processes, so I won't bore you with it again. All the results below were acquired while using taskset. For IPC you'll get better results when pinning to the same core (different threads) but worse tail. For TCP/UDP the best results I observed were across different cores on same socket. If you are running across 2 machines then ignore the above and pin as makes sense to you (on NUMA hardware the NIC can be aligned to a particular socket, have fun).
              The tool allows for further tweaking of weather or not it will yield when busy-spinning (-Dyield=true) and adding a wait between pings (-DwaitNanos=1000). These are provided to give you a flavour of what can happen as you relax the hot loops into something closer to a back-off strategy, and as you let the client/server 'drift in their attention'.

              Observing the results for the different flavours

              The keen observer will notice that average latency is not reported. Average latency is not latency. Average latency is just TimeUnit/throughput. If you have a latency SLA you should know that. An average is a completely inappropriate tool for measuring latency. Take for example the case where half your requests take 0.0001 millis and half take 99.9999 millis, how is the average latency of 50 millis useful to you? Gil Tene has a long presentation on the topic which is worth a watch if the above argument is completely foreign to you.
              The results are a range of percentiles, it's easy enough to add further analysis as all the observed latencies are recorded (all numbers are in nanoseconds). I considered using a histogram implementation (like the one in the Disruptor, or HdrHistogram) but decided it was better to stick to the raw data for something this small and focused. This way no precision is lost at the cost of a slightly larger memory footprint. This is not necessarily appropriate for every use case.
              Having said all that, here is a sample of the results for running the code on semi-respectable hardware (all runs are pinned using taskset, all on default settings, all numbers are in nanoseconds):
              Implementation, Min,   50%,   90%,   99%,   99.9%, 99.99%,Max
              IPC busy-spin,  89,    127,   168,   3326,  6501,  11555, 25131
              UDP busy-spin,  4597,  5224,  5391,  5958,  8466,  10918, 18396
              TCP busy-spin,  6244,  6784,  7475,  8697,  11070, 16791, 27265
              TCP select-now, 8858,  9617,  9845,  12173, 13845, 19417, 26171
              TCP block,      10696, 13103, 13299, 14428, 15629, 20373, 32149
              TCP select,     13425, 15426, 15743, 18035, 20719, 24793, 37877

              Bear in mind that this is RTT(Round Trip Time) so a request-response timing. The above measurement are also over loopback, so no actual network hop. The network hop on 2 machines hooked into each other via a network cable will be similar, anything beyond that and your actual network stack will become more and more significant. Nothing can cure geography ;-)
              I am sure there are further tweaks to make in the stack to improve the results. Maybe the code, maybe the OS tuning, maybe the JVM version. It doesn't matter. The point is you can take this and measure your stack. The numbers may differ, but the relative performance should be fairly similar.

              Is it lunch time?

              This is a bit of a detour, but bear with me. On the IPC side of things we should also start asking ourselves: what is the System.nanotime() measurement error? what sort of accuracy can we expect?
              I added an ErrPingClient which runs the test loop with no actual ping logic, the result:
              Min, 50%, 90%, 99%, 99.9%, 99.99%,Max
              38,  50,  55,  56,  59,    80,    8919

              Is this due to JVM hiccups? inherent inaccuracy of the underlying measurement method used by the JVM? in this sort of time scale the latency measurement becomes a problem onto itself and we have to revert to counting on (horrors!) average latency over a set of measurements to cancel out the inaccuracy. To quote the Hitchhikers Guide: "Time is an illusion, and lunch time doubly so", we are not going to get exact timings at this resolution, so we will need to deal with error. Dealing with this error is not something the code does for you, just be aware some error is to be expected.

              What is it good for?

              My aim with this tool (if you can call it that) was to uncover baseline costs of network operations on a particular setup. This is a handy figure to have when judging the overhead introduced by a framework/API. No framework in the world could beat a bare bones implementation using the same ingredients, but knowing the difference educates our shopping decisions. For example, if your 'budget' for response time is low the overhead introduced by the framework of your choice might not be appropriate. If the overhead is very high perhaps there is a bug in the framework or how you use it.
              As the tool is deployable you can also use it to validate the setup/configuration and use that data to help expose issues independent of your software.
              Finally, it is a good tool to help people who have grown to expect Java server applications response time to be in the tens of milliseconds range wake up and smell the scorching speed of today's hardware :-) 
              Viewing all 76 articles
              Browse latest View live